Original Link: https://www.anandtech.com/show/11104/the-patriot-hellfire-m2-480gb-review-phison-nvme-tested
The Patriot Hellfire M.2 480GB Review: Phison NVMe Tested
by Billy Tallis on February 10, 2017 8:30 AM EST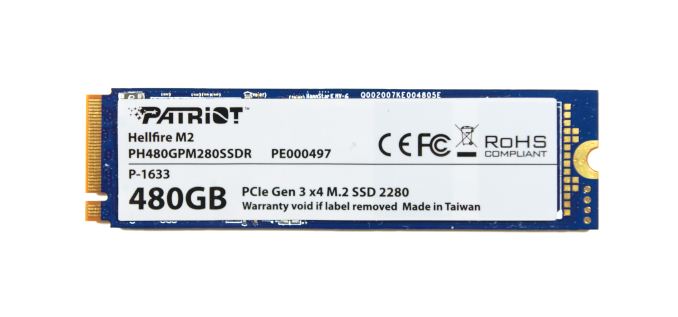
The Patriot Hellfire M.2 PCIe SSD is Patriot's first NVMe SSD, and one of several similar products based on Phison's E7 NVMe controller. As usual for Phison, the same drive is manufactured for many of their partners, who typically customize only the branding. Phison designs the controller, firmware, and PCB, but leaves the marketing up to their partners.
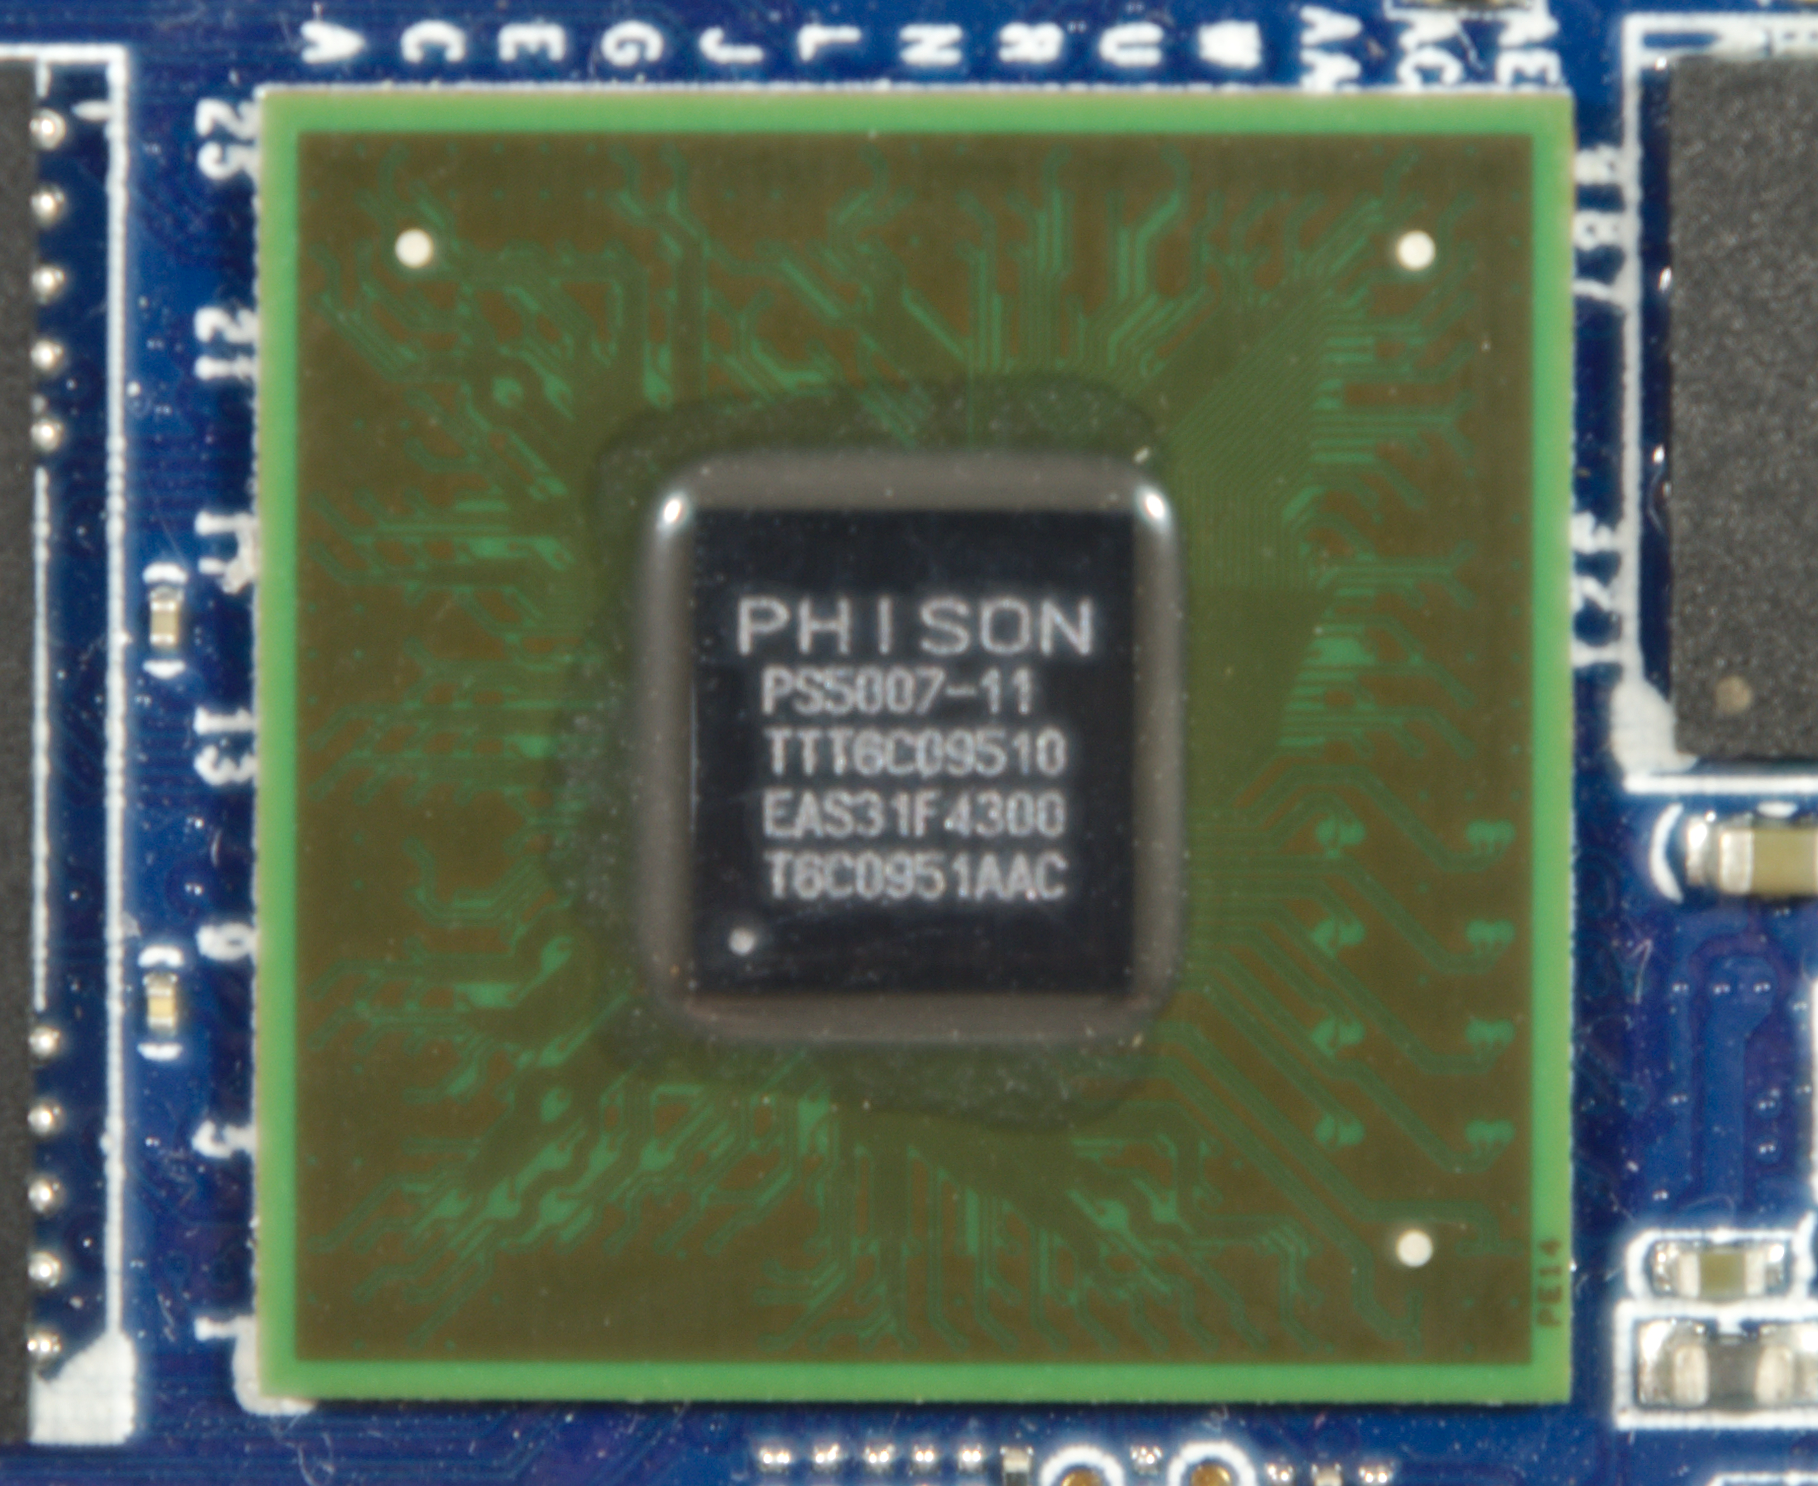
Phison's PS5007-E7 controller is their first NVMe SSD controller, supporting a PCIe 3.0 x4 host interface and 8 channels for NAND access. The details we have on the E7 are a bit slim - some collection of ARM cores under the hood is a safe bet, but that's it - however we do know that the E7 controller is manufactured on TSMC's 28nm process and uses FCBGA packaging. Interestingly, it doesn't use the kind of large heatspreader we've seen on competing controllers like Silicon Motion's SM2260. Phison had the E7 platform hardware ready over a year ago, but retail releases were held back by the poor performance of early firmware. Patriot first began shipping the Hellfire last fall, but even after that much delay, they ended up issuing a firmware update shortly after launch.
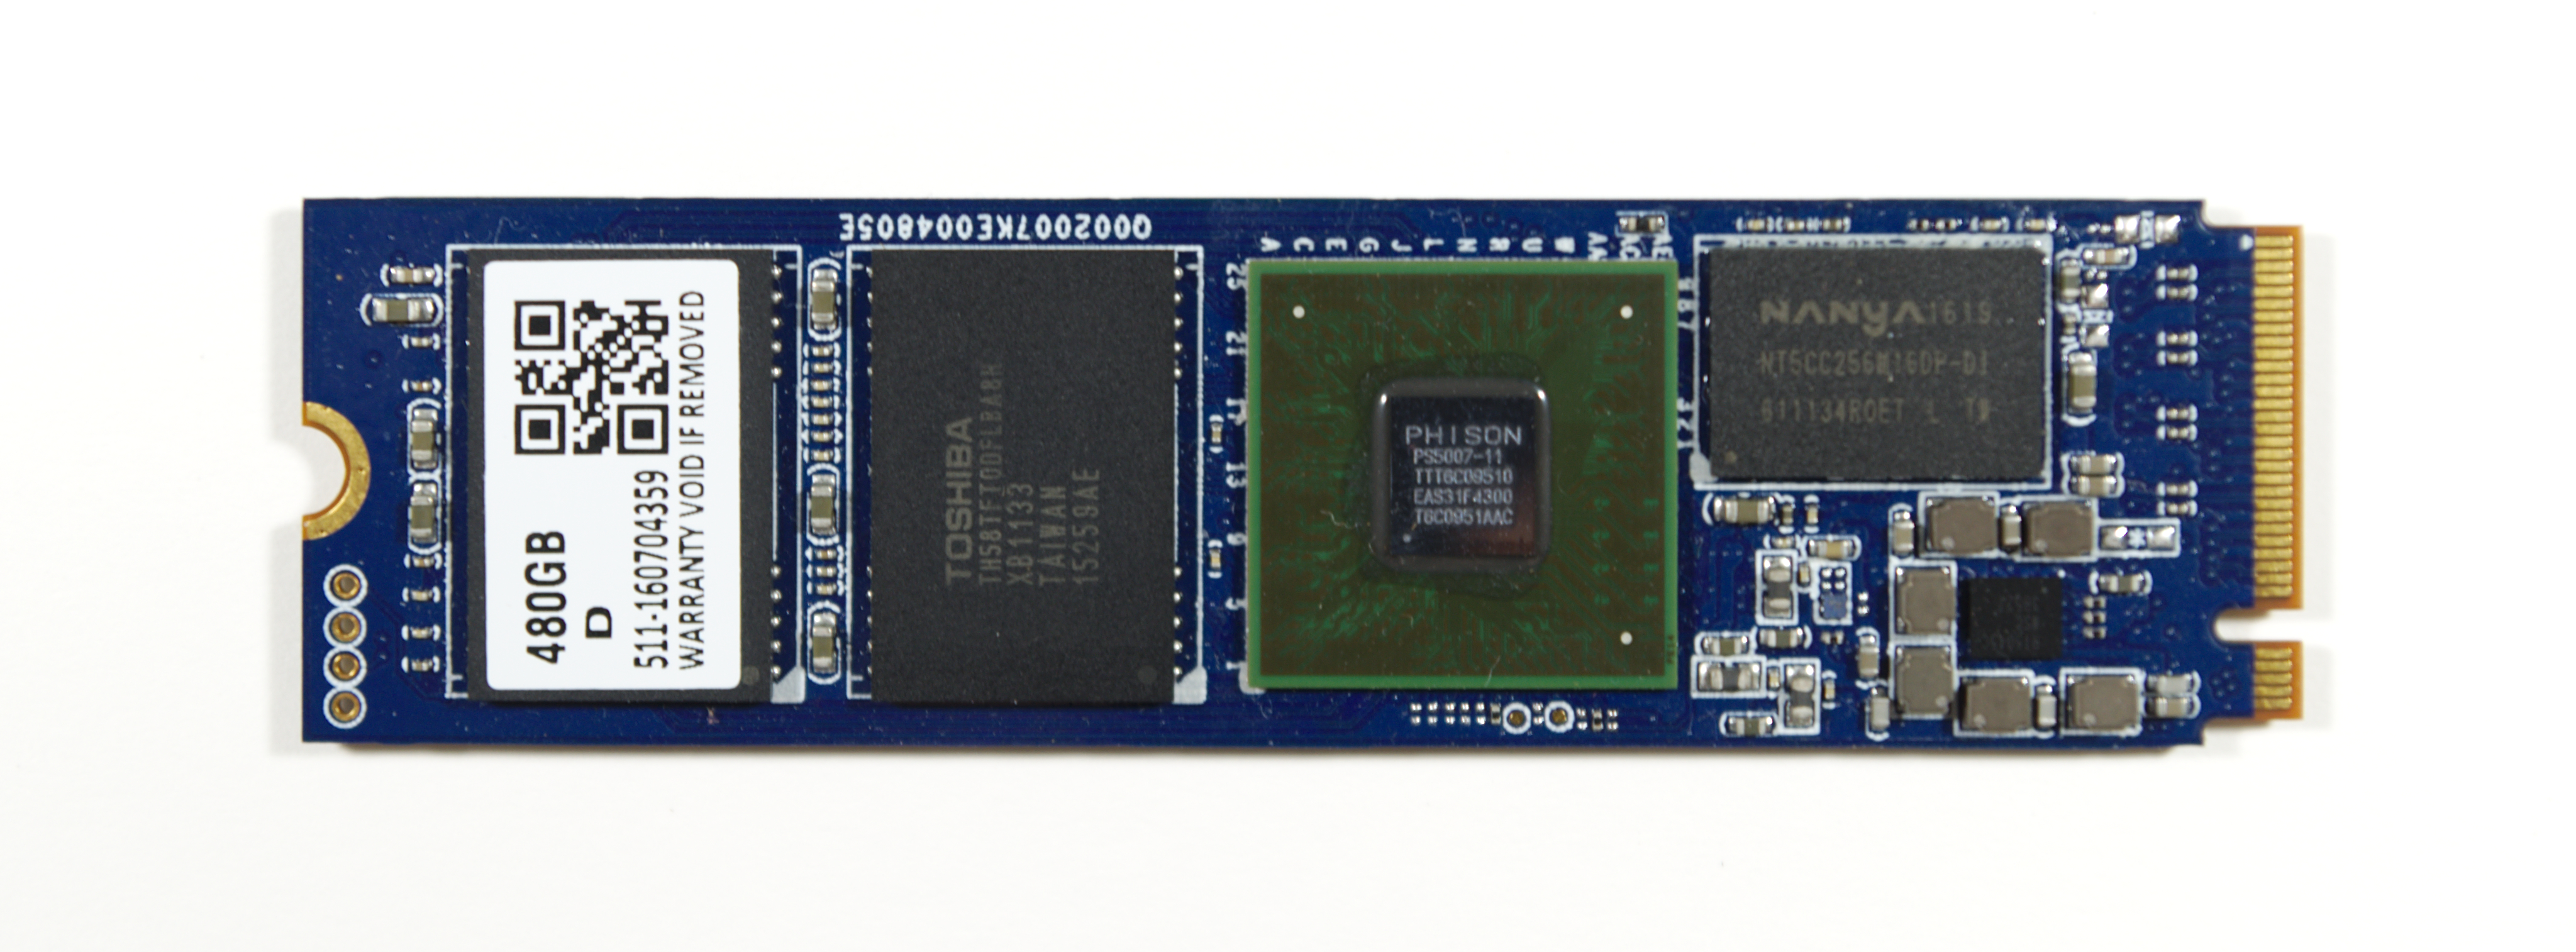
Phison's controllers are almost always paired with Toshiba's NAND flash, and the Patriot Hellfire uses Toshiba's 15nm MLC. Our review sample is the 480 GB version, the most common capacity for E7 SSD. Patriot also sells a 240 GB version, and some of their competitors offer the 120GB version as well.
| Patriot Hellfire Specifications Comparison | |||
| 240 GB | 480 GB | ||
| Form Factor | M.2 2280 | ||
| Controller | Phison PS5007-E7 | ||
| Interface | NVMe PCIe 3.0 x4 | ||
| DRAM | 256MB DDR3L | 512MB DDR3L | |
| NAND | Toshiba 15nm MLC | ||
| Sequential Read (CDM) | 2740 MB/s | 2550 MB/s | |
| Sequential Write | 1090 MB/s | 1260 MB/s | |
| 4KB Random Read (QD32) | 170k IOPS | 170k IOPS | |
| 4KB Random Write (QD32) | 185k IOPS | 210k IOPS | |
| Warranty | 3 years | ||
| MSRP | $130 (54¢/GB) | $230 (48¢/GB) | |
The Phison E7 controller was originally intended to be a high-end NVMe controller for client or enterprise use. By the time it was ready for the market, Samsung had raised the bar far too high for the E7 to still be considered high-end. But Phison E7-based SSDs like the Patriot Hellfire have been able to offer very attractive pricing and are usually the cheapest MLC-based NVMe SSDs available. Without the pitfalls of TLC-based SSDs like the Intel SSD 600p and the Samsung 960 EVO, the Patriot Hellfire and its relatives have been attractive entry-level PCIe SSD options.
Aside from other Phison E7 SSDs, the closest competition for the Patriot Hellfire is the Plextor M8Pe, based on the same Toshiba 15nm MLC NAND but using the Marvell 88SS1093 controller with Plextor's own firmware. The Patriot Hellfire also has to justify its higher price relative to the Intel SSD 600p, the most affordable NVMe SSD, and against high-performing SATA SSDs like Samsung's 850 EVO and 850 PRO.
| AnandTech 2015 SSD Test System | |
| CPU | Intel Core i7-4770K running at 3.5GHz (Turbo & EIST enabled, C-states disabled) |
| Motherboard | ASUS Z97 Pro (BIOS 2701) |
| Chipset | Intel Z97 |
| Memory | Corsair Vengeance DDR3-1866 2x8GB (9-10-9-27 2T) |
| Graphics | Intel HD Graphics 4600 |
| Desktop Resolution | 1920 x 1200 |
| OS | Windows 8.1 x64 |
- Thanks to Intel for the Core i7-4770K CPU
- Thanks to ASUS for the Z97 Deluxe motherboard
- Thanks to Corsair for the Vengeance 16GB DDR3-1866 DRAM kit, RM750 power supply, Carbide 200R case, and Hydro H60 CPU cooler
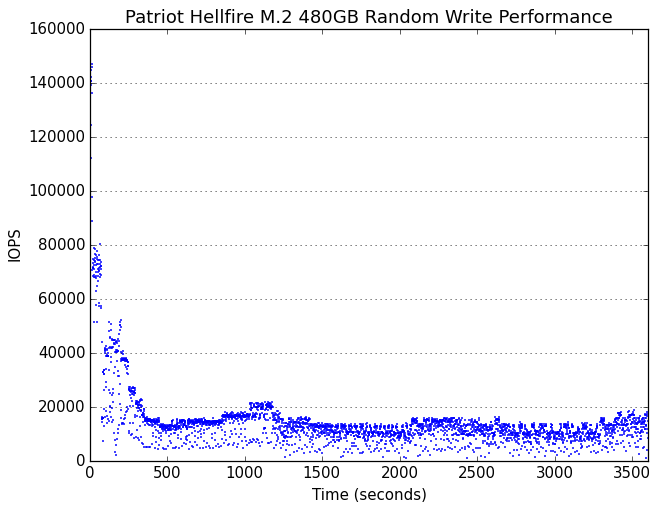
Performance Consistency
Our performance consistency test explores the extent to which a drive can reliably sustain performance during a long-duration random write test. Specifications for consumer drives typically list peak performance numbers only attainable in ideal conditions. The performance in a worst-case scenario can be drastically different as over the course of a long test drives can run out of spare area, have to start performing garbage collection, and sometimes even reach power or thermal limits.
In addition to an overall decline in performance, a long test can show patterns in how performance varies on shorter timescales. Some drives will exhibit very little variance in performance from second to second, while others will show massive drops in performance during each garbage collection cycle but otherwise maintain good performance, and others show constantly wide variance. If a drive periodically slows to hard drive levels of performance, it may feel slow to use even if its overall average performance is very high.
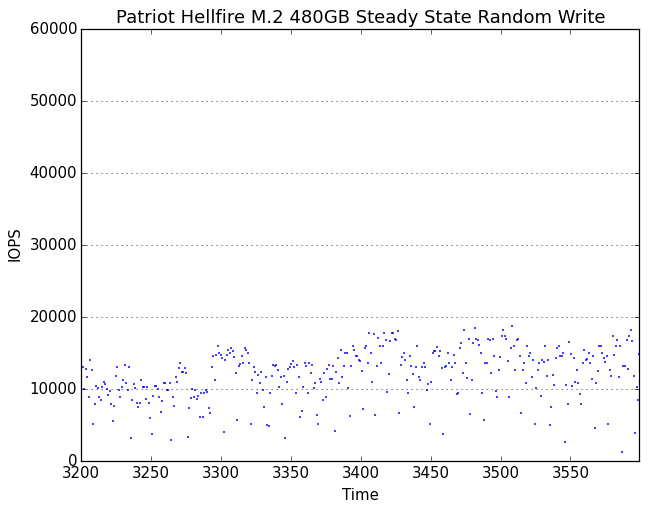
To maximally stress the drive's controller and force it to perform garbage collection and wear leveling, this test conducts 4kB random writes with a queue depth of 32. The drive is filled before the start of the test, and the test duration is one hour. Any spare area will be exhausted early in the test and by the end of the hour even the largest drives with the most overprovisioning will have reached a steady state. We use the last 400 seconds of the test to score the drive both on steady-state average writes per second and on its performance divided by the standard deviation.
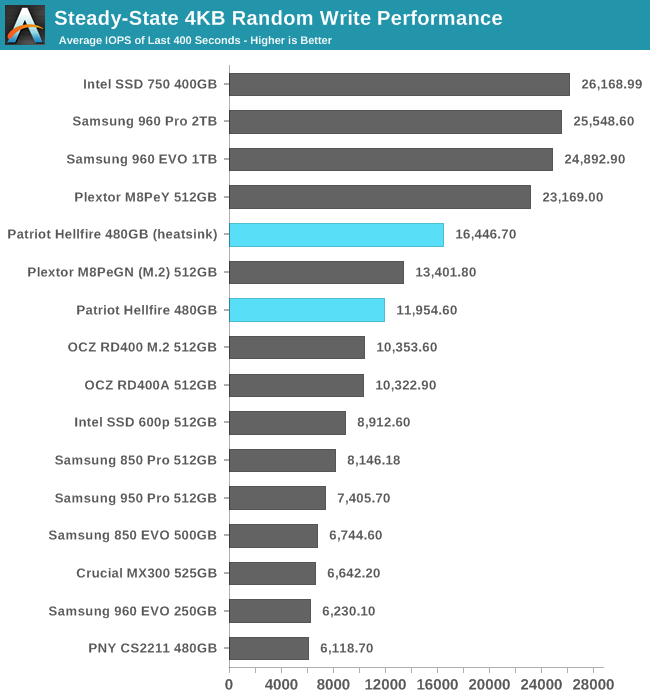
The Patriot Hellfire maintains a higher average random write speed than the significantly more expensive OCZ RD400 and the older Samsung 950 PRO, but the Plextor M8Pe performs even better, especially when heatsinks are used.
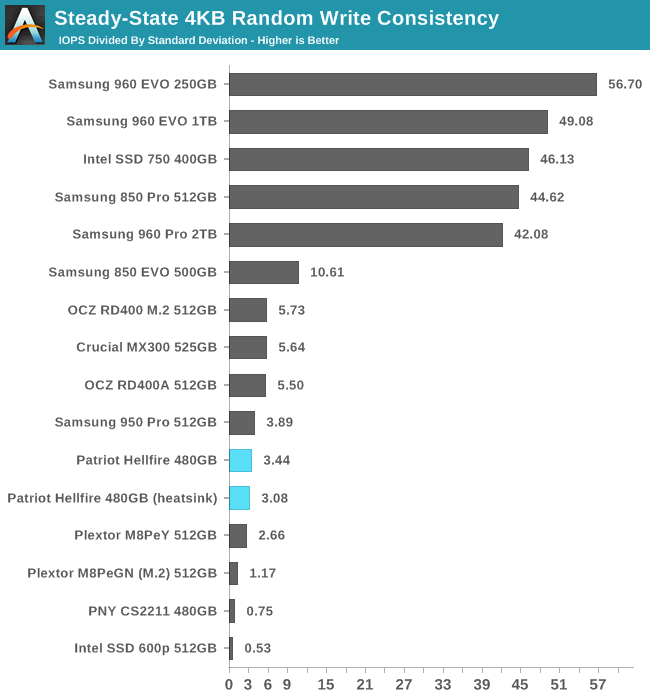
The Patriot Hellfire does not have the very high consistency of the Intel SSD 750 or most of Samsung's SSDs, but the score is not worryingly low. For consumer-oriented products, consistency under sustained write load is generally a lower priority than high burst performance and quick recovery during idle times.
 |
|||||||||
| Default | |||||||||
| 25% Over-Provisioning | |||||||||
The Patriot Hellfire shows some long-term fluctuations in random write performance, especially when equipped with a heatsink to allow for higher peak performance. With extra overprovisioning, the long-term trend is very stable and the effect of the heatsink is greatly reduced.
 |
|||||||||
| Default | |||||||||
| 25% Over-Provisioning | |||||||||
On shorter time scales, the Patriot Hellfire is never particularly consistent. Adding a heatsink increases the peak performance but only helps the minimums slightly. Adding extra overprovisioning greatly increases the amount of time spent operating at or near peak performance, but does not entirely eliminate the drops down below 5k IOPS.
AnandTech Storage Bench - The Destroyer
The Destroyer is an extremely long test replicating the access patterns of very IO-intensive desktop usage. A detailed breakdown can be found in this article. Like real-world usage and unlike our Iometer tests, the drives do get the occasional break that allows for some background garbage collection and flushing caches, but those idle times are limited to 25ms so that it doesn't take all week to run the test.
We quantify performance on this test by reporting the drive's average data throughput, a few data points about its latency, and the total energy used by the drive over the course of the test.
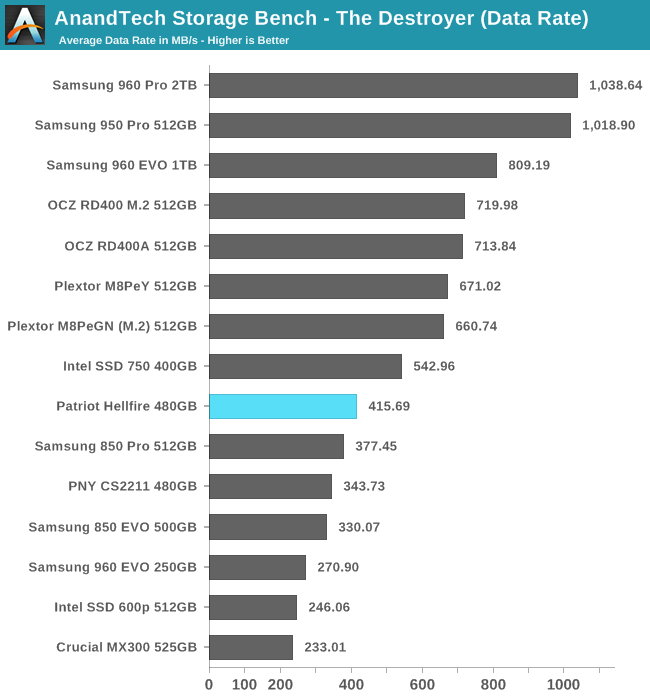
The Patriot Hellfire's average data rate on The Destroyer is slightly better than the fastest SATA SSD, but it is clearly the slowest MLC NVMe SSD in this bunch, and half the speed of Samsung's best.
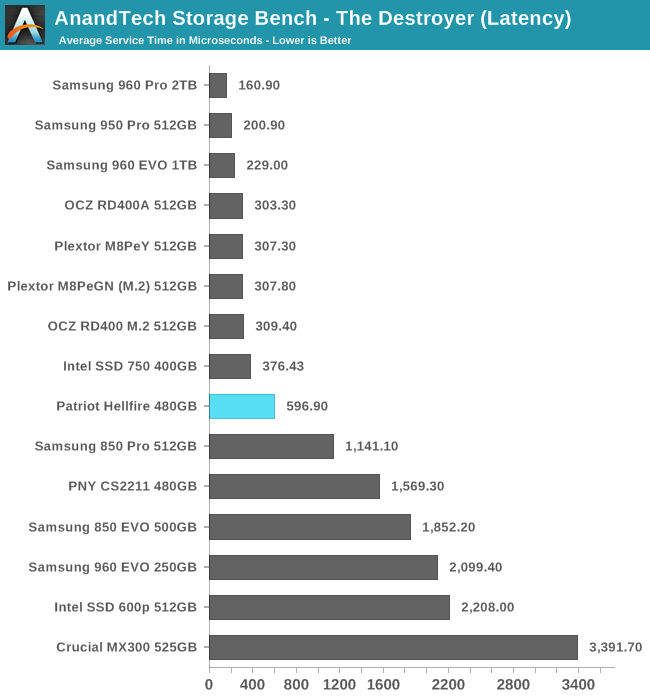
The Patriot Hellfire squanders some of the latency advantages of NVMe, with an average service time that is sitting in the middle of the gap between SATA SSDs and other MLC NVMe SSDs.
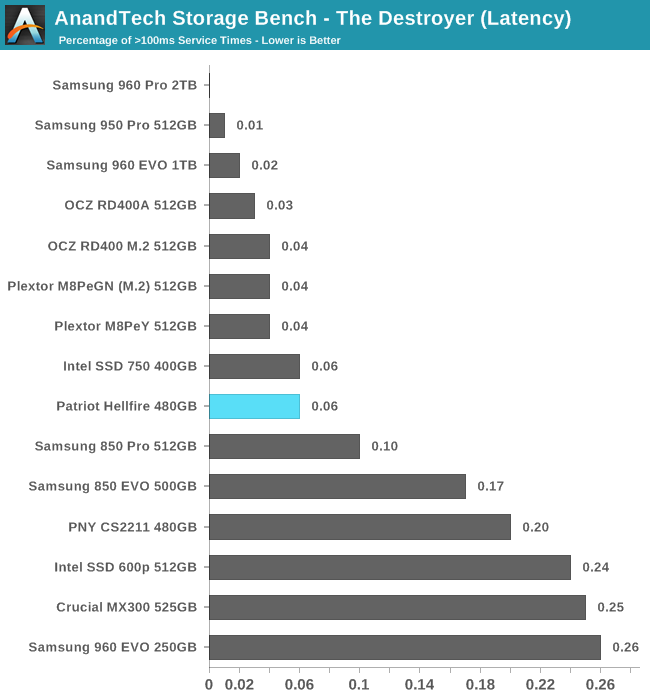
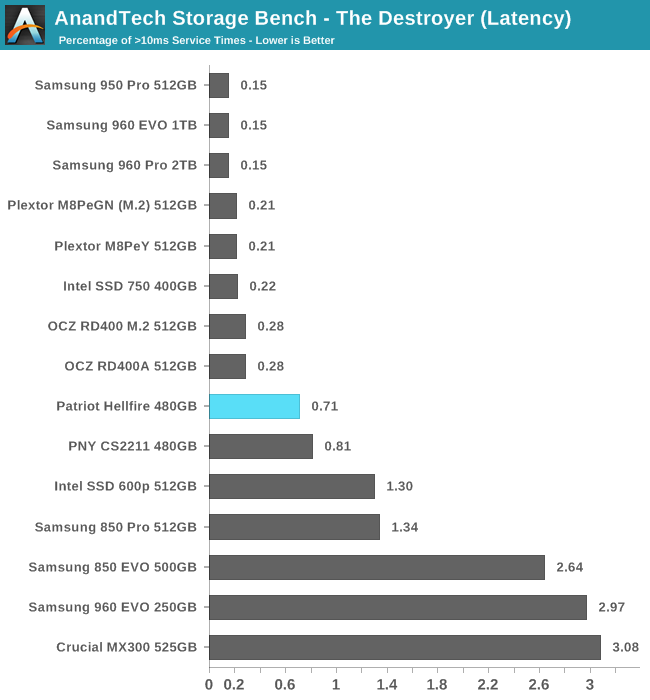
The Patriot Hellfire ties with the aging Intel SSD 750 for the number of latency outliers beyond 100ms, but at the 10ms level it is only barely ahead of the best SATA drive and has almost three times as many outliers as the next slowest NVMe SSD.
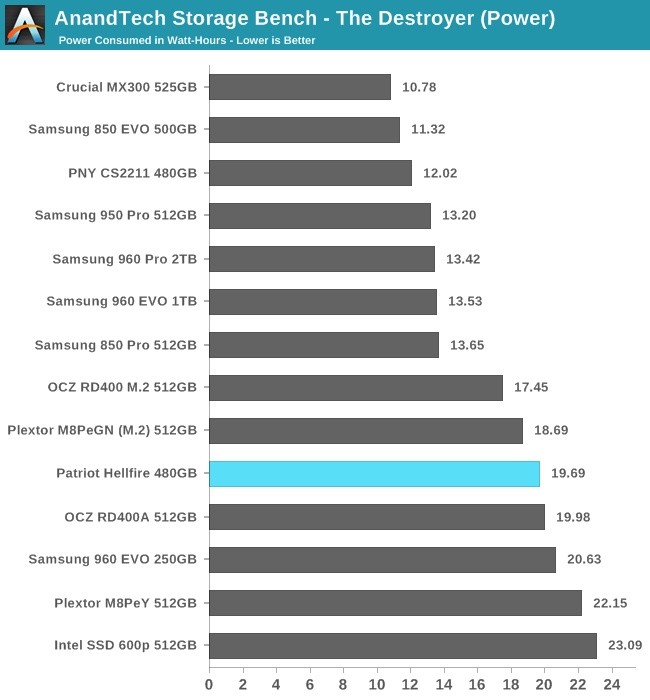
As with most NVMe SSDs, the Patriot Hellfire burns substantially more energy over the course of The Destroyer than any good SATA SSD. Samsung remains the only company to deliver a PCIe SSD that is on par with SATA SSDs for this power usage metric.
AnandTech Storage Bench - Heavy
Our Heavy storage benchmark is proportionally more write-heavy than The Destroyer, but much shorter overall. The total writes in the Heavy test aren't enough to fill the drive, so performance never drops down to steady state. This test is far more representative of a power user's day to day usage, and is heavily influenced by the drive's peak performance. The Heavy workload test details can be found here.
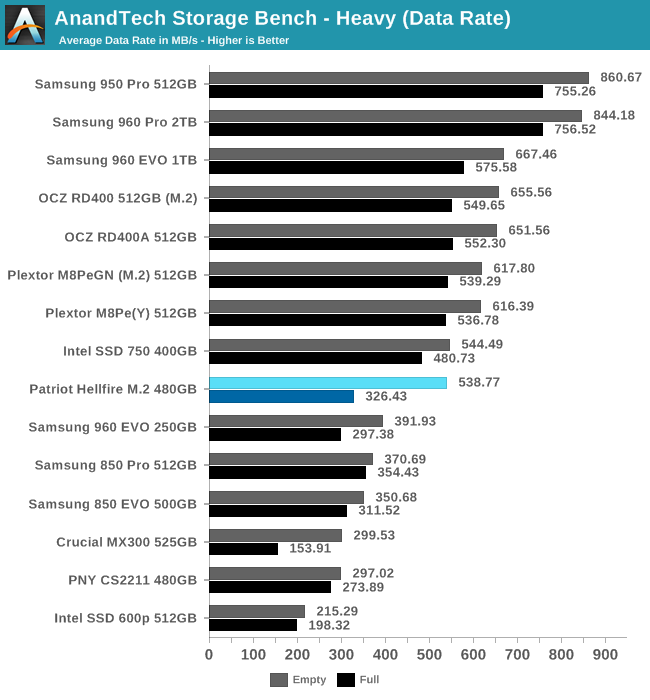
The Patriot Hellfire exhibits an unusually large disparity in performance when the Heavy test is run on a full drive compared to an empty drive. Fresh out of the box, the Hellfire largely keeps pace with the other MLC NVMe SSDs, but when full its average data rate drops down into the high end of SATA performance territory.
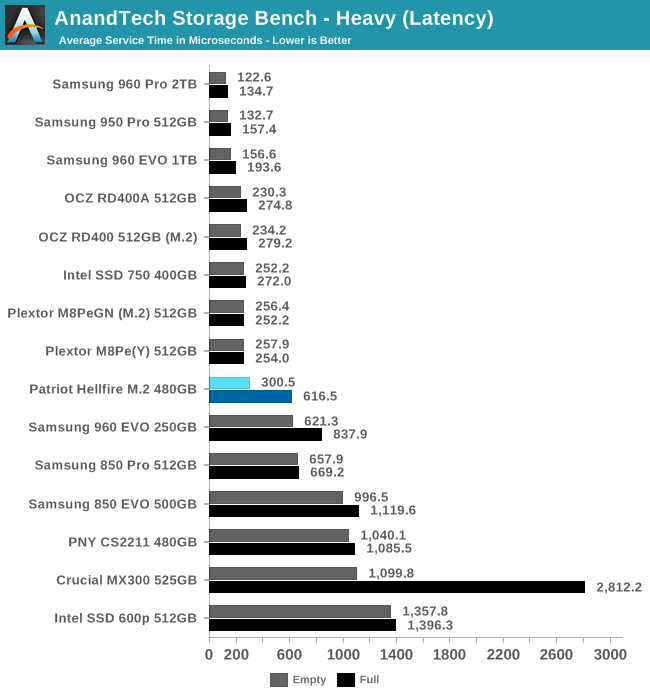
The average service times tell the same story as the average data rates: when the Patriot Hellfire is not filled, it can be lumped in with most of the other NVMe SSDs, but when it is completely full it loses almost all of its advantage over high-end SATA SSDs.
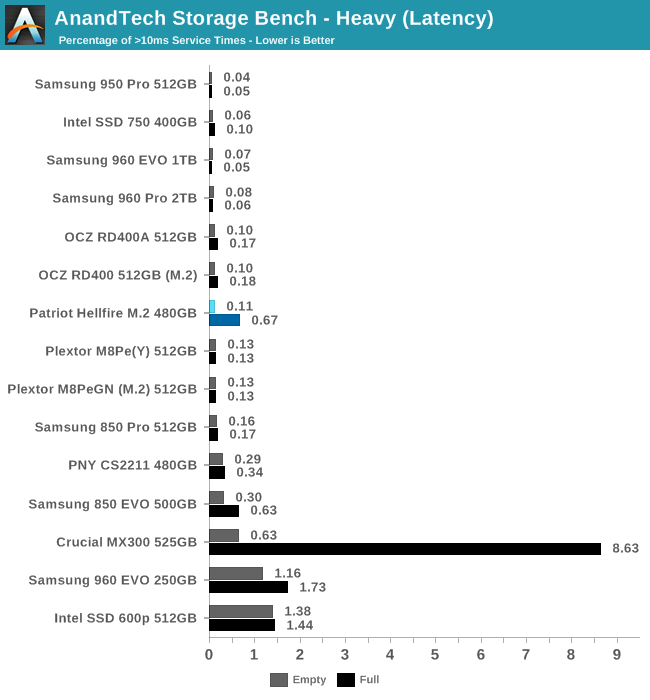
The Patriot Hellfire experiences relatively few high-latency outliers when the Heavy test is run on a fresh drive, but when filled is experiences substantially more outliers and it ranks worse than any MLC SSD in this comparison—NVMe or SATA.
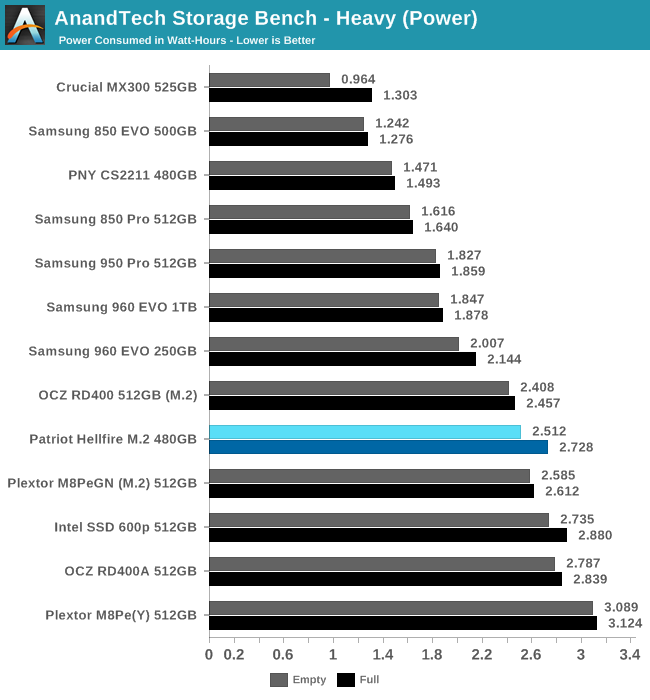
The Patriot Hellfire is not the most power-hungry NVMe SSD in this bunch, but it is still substantially less efficient than Samsung's SSDs and mainstream SATA SSDs.
AnandTech Storage Bench - Light
Our Light storage test has relatively more sequential accesses and lower queue depths than The Destroyer or the Heavy test, and it's by far the shortest test overall. It's based largely on applications that aren't highly dependent on storage performance, so this is a test more of application launch times and file load times. This test can be seen as the sum of all the little delays in daily usage, but with the idle times trimmed to 25ms it takes less than half an hour to run. Details of the Light test can be found here.
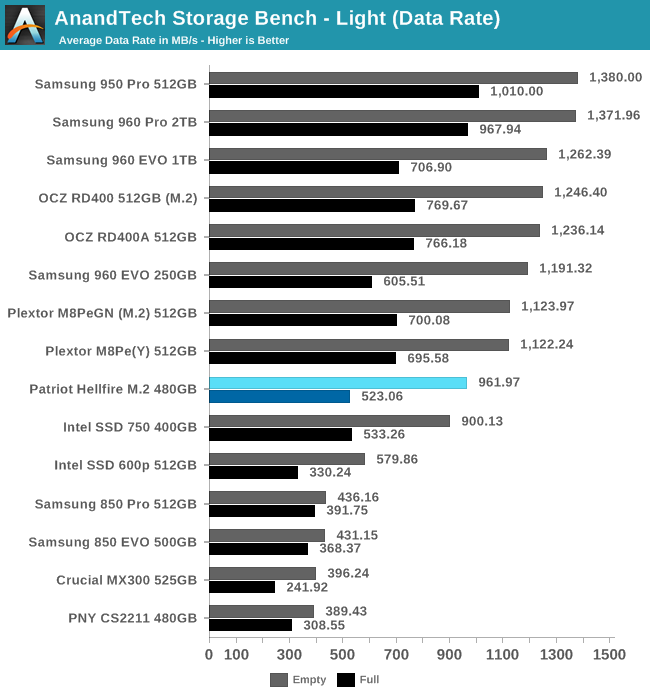
Filled or not, the Patriot Hellfire manages to keep pace with the Intel SSD 750 and provide a higher average data rate than any SATA SSD can manage on the Light test.
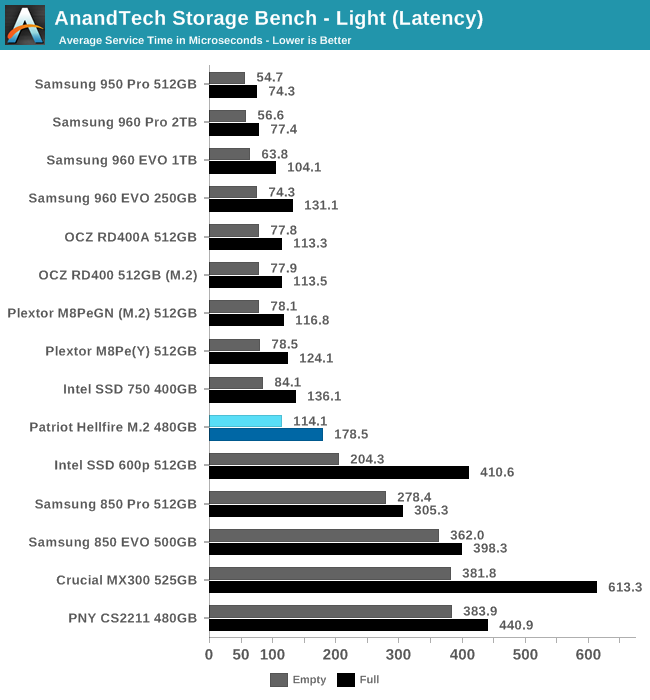
The average service times of the Patriot Hellfire are slightly worse than the Intel SSD 750 and the more recent NVMe SSDs, but are still better than the Intel SSD 600p or any SATA SSD.

Samsung's 960 PRO and EVO are the only NVMe SSDs that don't show a significant increase in high-latency outliers when filled. The Patriot Hellfire's performance is essentially tied with the Plextor M8Pe and is comparable to most other MLC NVMe SSDs.
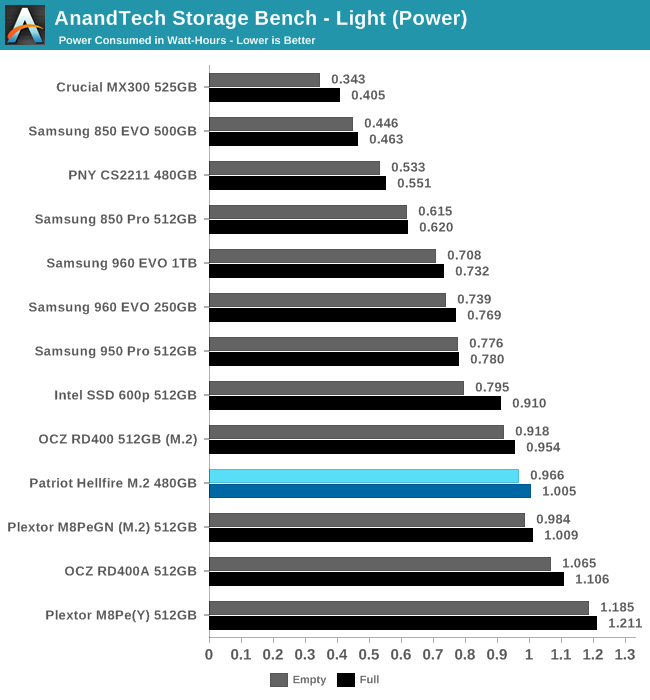
The power efficiency advantage of a good SATA SSD is very clear on this test, as the Patriot Hellfire and most other PCIe SSDs use two to three times the energy to complete the Light test.
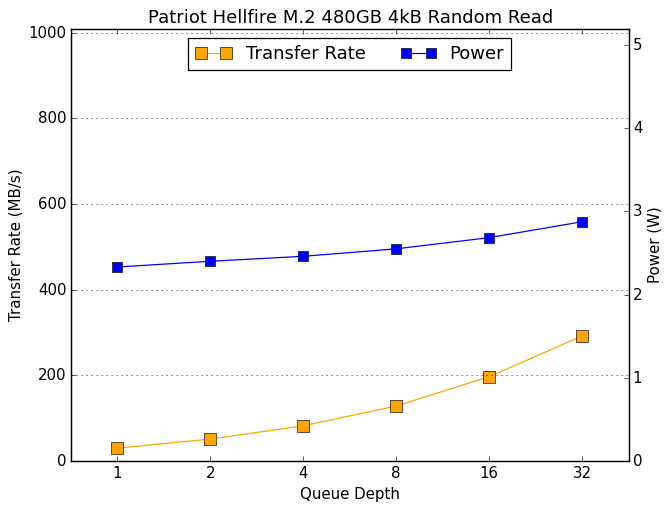
Random Read Performance
The random read test requests 4kB blocks and tests queue depths ranging from 1 to 32. The queue depth is doubled every three minutes, for a total test duration of 18 minutes. The test spans the entire drive, which is filled before the test starts. The primary score we report is an average of performances at queue depths 1, 2 and 4, as client usage typically consists mostly of low queue depth operations.
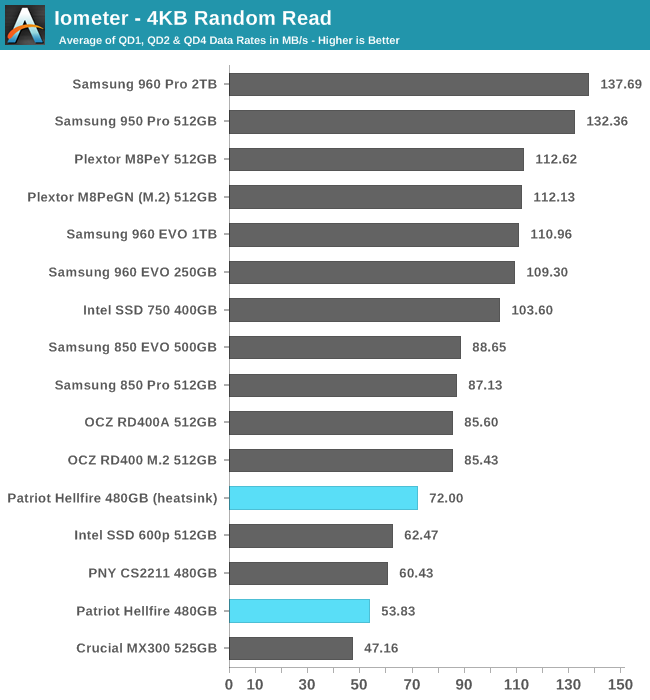
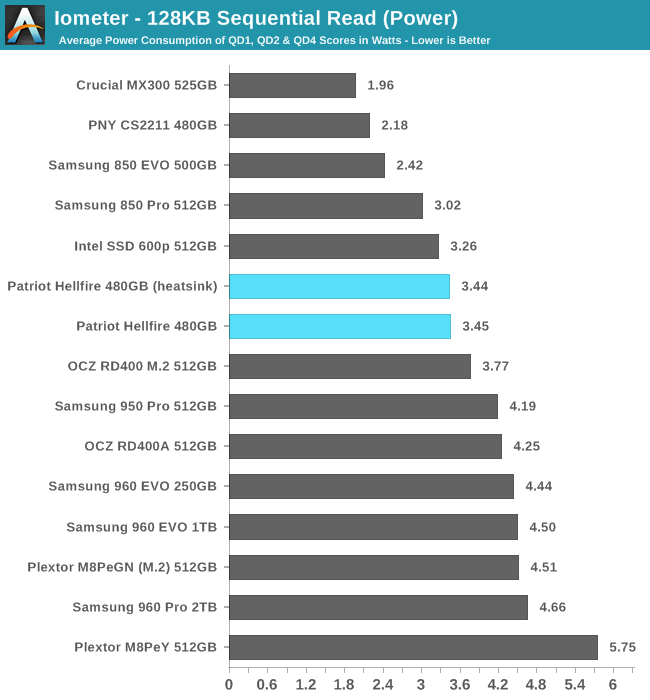
The random read performance of the Patriot Hellfire is disappointing, even when aided by a heatsink. Samsung's SATA SSDs outperform the Patriot Hellfire, and the Plextor M8Pe is twice as fast. The PNY CS2211—based on the same NAND and Phison's S10 SATA SSD controller—is the most embarrassing drive for the Hellfire to lose to.
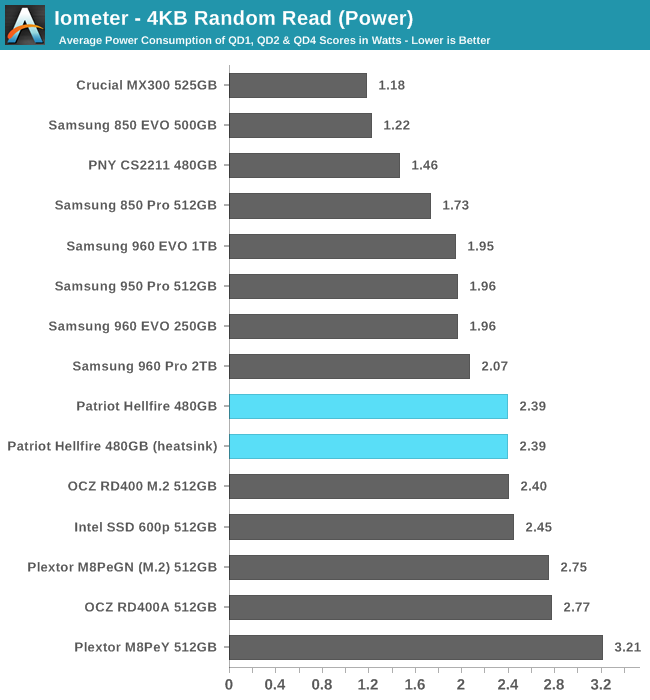
With no particular advantage in power consumption, the Patriot Hellfire gets a very poor efficiency score for random reads.
 |
|||||||||
The poor random read performance at lower queue depths continues at higher queue depths, and the Patriot Hellfire cannot catch up to the Samsung 850 Pro without a heatsink.
Random Write Performance
The random write test writes 4kB blocks and tests queue depths ranging from 1 to 32. The queue depth is doubled every three minutes, for a total test duration of 18 minutes. The test is limited to a 16GB portion of the drive, and the drive is empty save for the 16GB test file. The primary score we report is an average of performances at queue depths 1, 2 and 4, as client usage typically consists mostly of low queue depth operations.
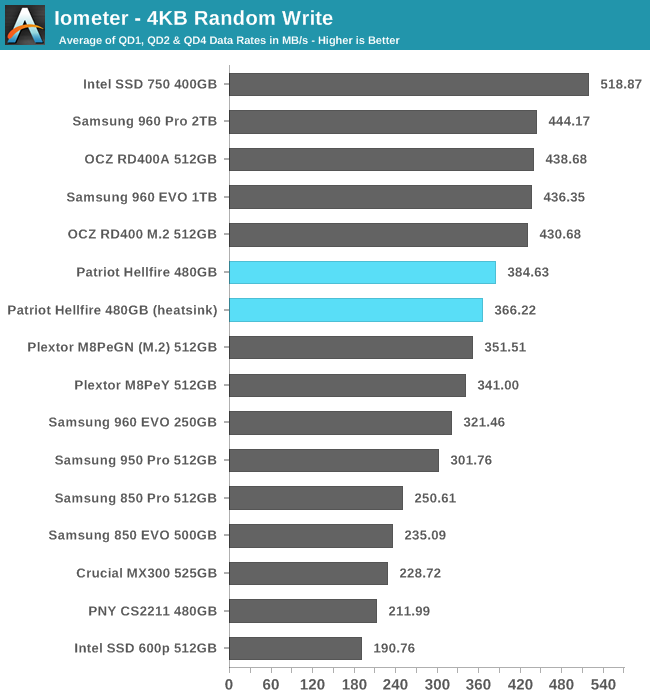
The random write performance of the Patriot Hellfire is relatively good, but it is not in the top tier. The average score with a heatsink is actually slightly lower than without, likely because the heatsink allows for higher performance early in the test, and then the drive's spare area starts to run out sooner.
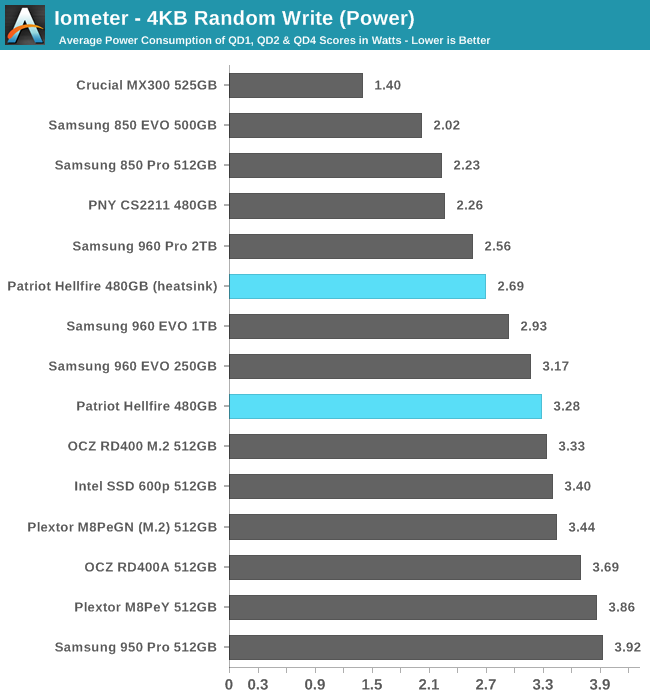
The Patriot Hellfire delivers better efficiency than most other NVMe SSDs and thanks to its good performance it is even substantially more efficient than the lower-power SATA SSDs.
 |
|||||||||
With or without a heatsink, the Patriot Hellfire's random write speed tops out at QD4 around 600MB/s. Most SSDs experience little to no improvement past this point. The Plextor M8Pe continues to slowly improve, but at QD4 its performance is sub-par.
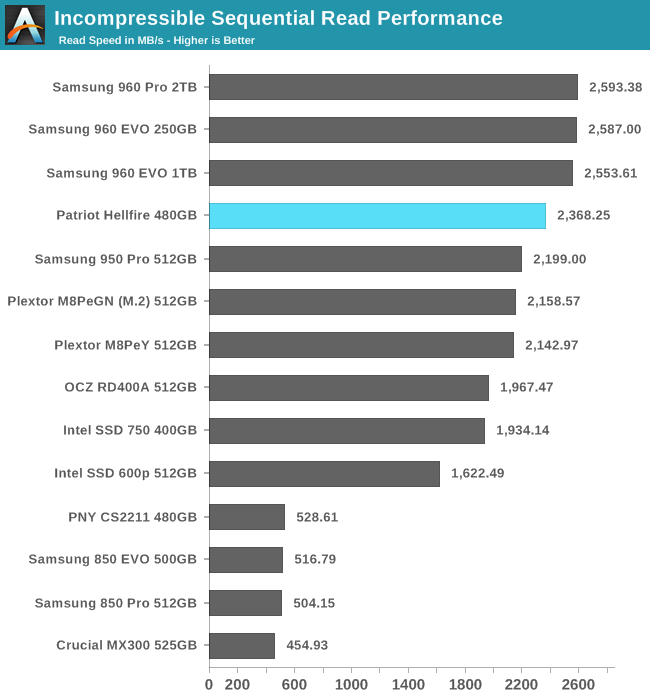
Sequential Read Performance
The sequential read test requests 128kB blocks and tests queue depths ranging from 1 to 32. The queue depth is doubled every three minutes, for a total test duration of 18 minutes. The test spans the entire drive, and the drive is filled before the test begins. The primary score we report is an average of performances at queue depths 1, 2 and 4, as client usage typically consists mostly of low queue depth operations.
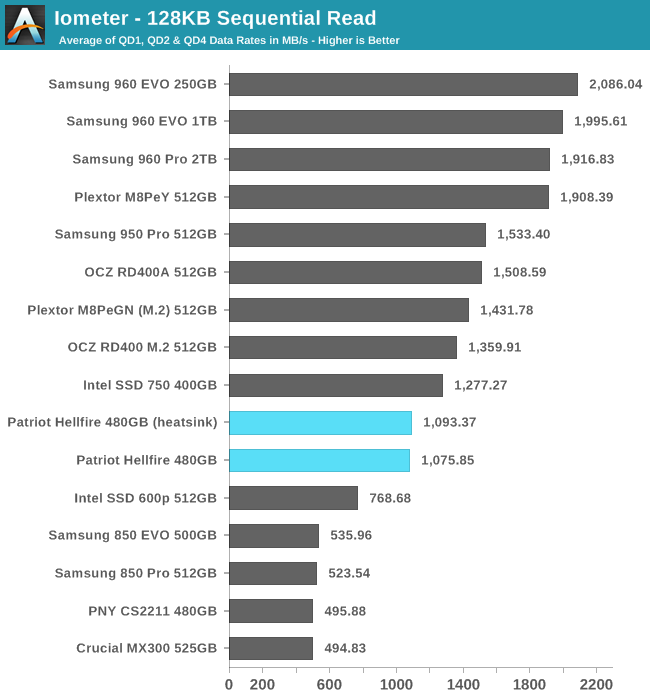
The sequential read speeds of the Patriot Hellfire are clearly slower than almost every other NVMe SSD, but it's still twice as fast as SATA SSDs. The TLC-based Intel SSD 600p falls in between the SATA SSDs and the Patriot Hellfire.
The Patriot Hellfire is also one of the lowest-power NVMe SSDs during sequential reads, so its efficiency isn't particularly poor for this test.
 |
|||||||||
Near the end of the sequential read test the Patriot Hellfire's performance falters as it hits thermal limits, but the addition of a heatsink allows it to eventually catch up to the performance levels most other NVMe SSDs hit at much lower queue depths.
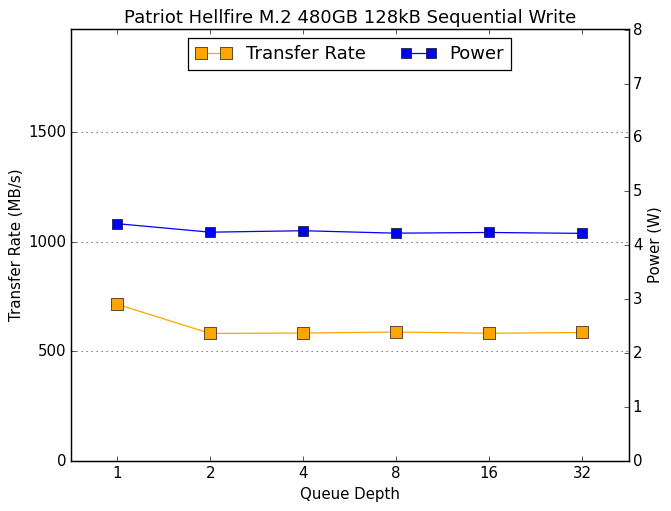
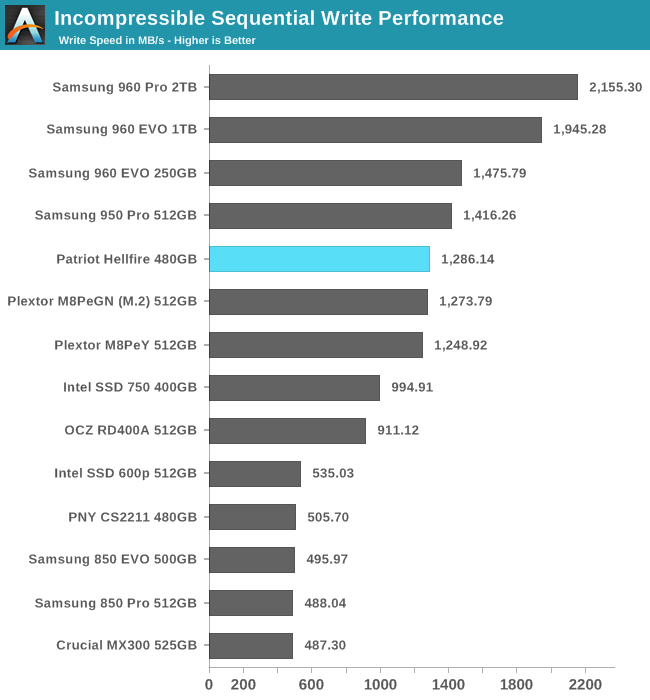
Sequential Write Performance
The sequential write test writes 128kB blocks and tests queue depths ranging from 1 to 32. The queue depth is doubled every three minutes, for a total test duration of 18 minutes. The test spans the entire drive, and the drive is filled before the test begins. The primary score we report is an average of performances at queue depths 1, 2 and 4, as client usage typically consists mostly of low queue depth operations.
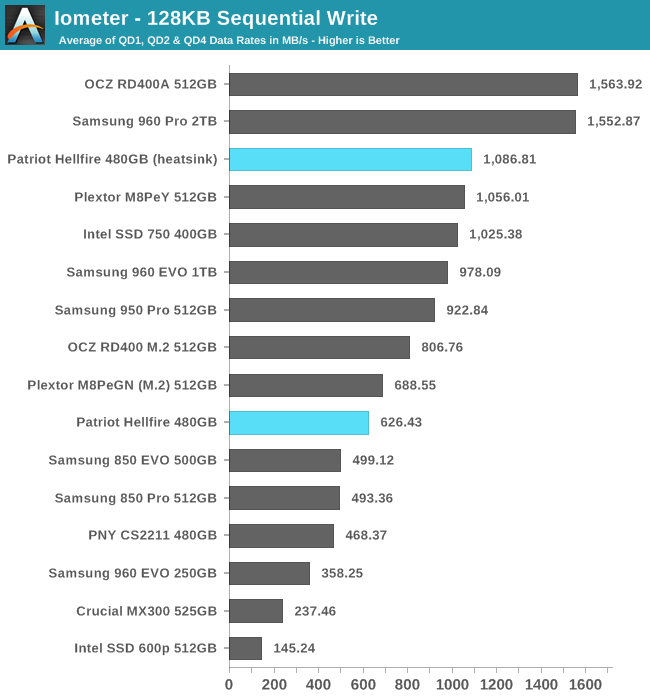
The heatsink makes a huge difference to the Patriot Hellfire's sustained sequential write performance, allowing it to pull slightly ahead of the Plextor M8PeY, but still leaving it far behind the OCZ RD400A.
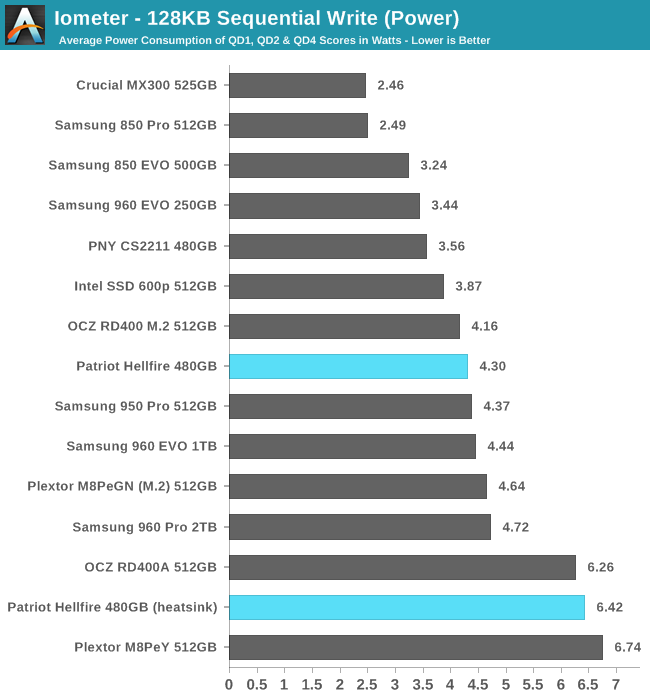
The Patriot Hellfire's efficiency is worse than its competition both with and without a heatsink attached. With a heatsink, it hits the highest power draw of any SSD in this bunch, after discounting the power used by the M8PeY's LEDs.
 |
|||||||||
Without a heatsink, the Patriot Hellfire is thermally limited by the end of the QD1 test phase, and performance is completely flat for the rest of the test. With a heatsink, the performance scales substantially from QD1 to QD4 before reaching thermal limits.
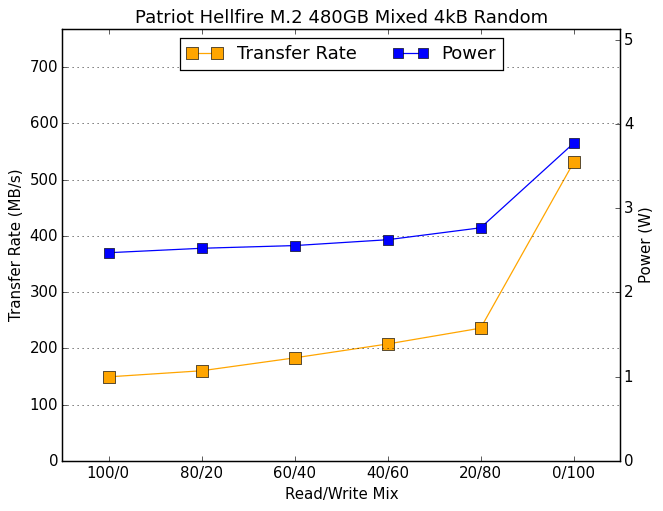
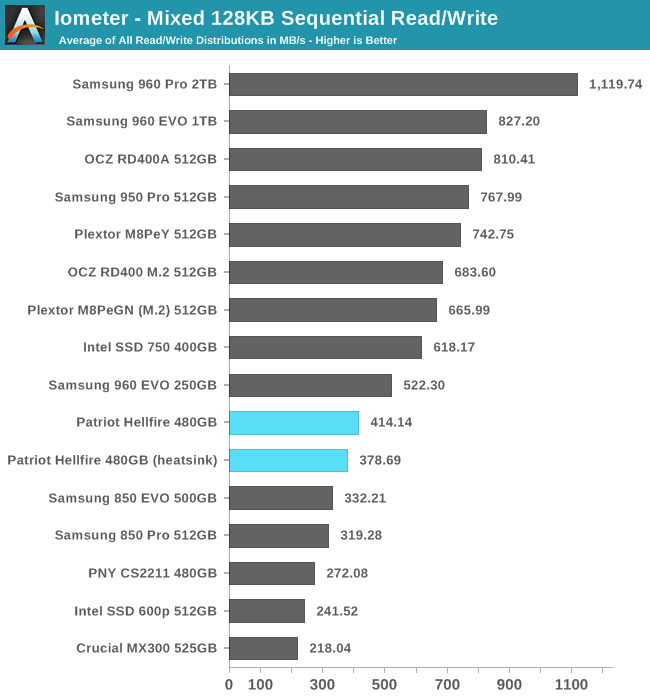
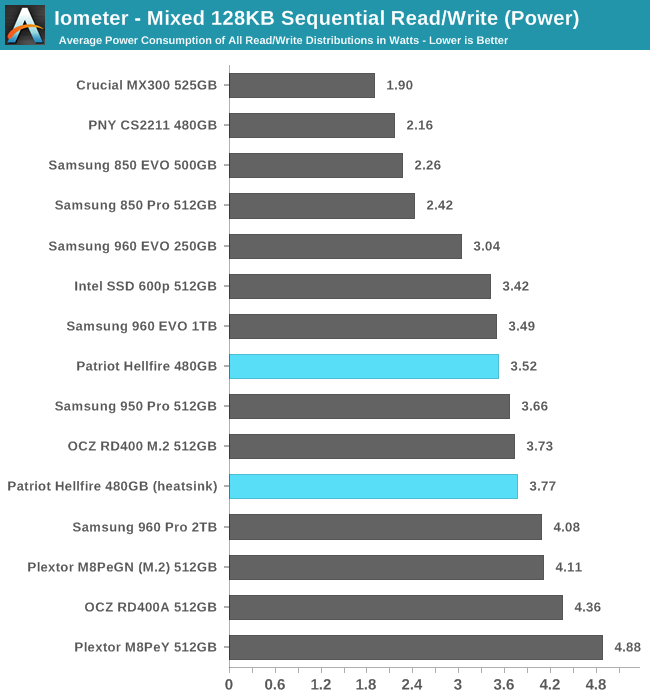
Mixed Random Read/Write Performance
The mixed random I/O benchmark starts with a pure read test and gradually increases the proportion of writes, finishing with pure writes. The queue depth is 3 for the entire test and each subtest lasts for 3 minutes, for a total test duration of 18 minutes. As with the pure random write test, this test is restricted to a 16GB span of the drive, which is empty save for the 16GB test file.
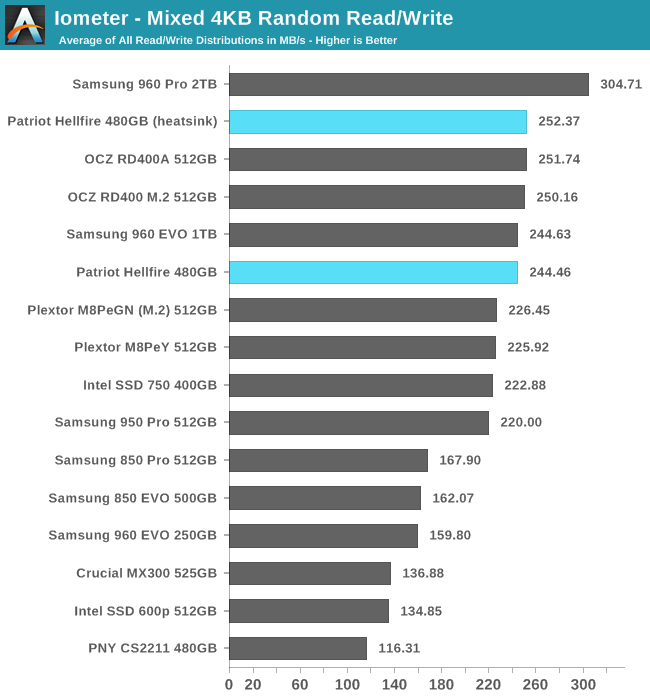
The Patriot Hellfire has great performance on the mixed random I/O test, tying the OCZ RD400 and falling behind only the much larger 2TB Samsung 960 PRO.
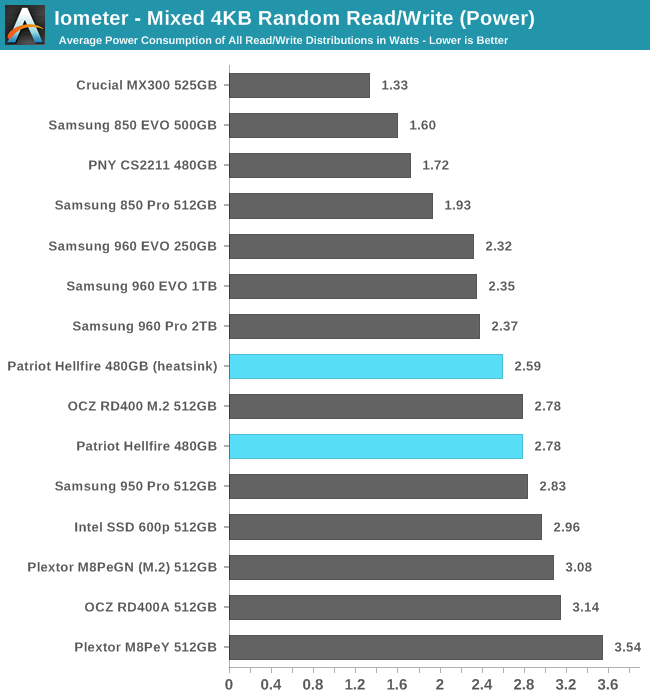
The Patriot Hellfire draws more power than the Samsung drives, but otherwise is one of the most efficient drives on the mixed random I/O test.
 |
|||||||||
Performance increases slowly but steadily as the portion of cacheable writes increases, but the spike in performance when the workload shifts to pure writes is not as big as exhibited by some of the Patriot Hellfire's competitors.
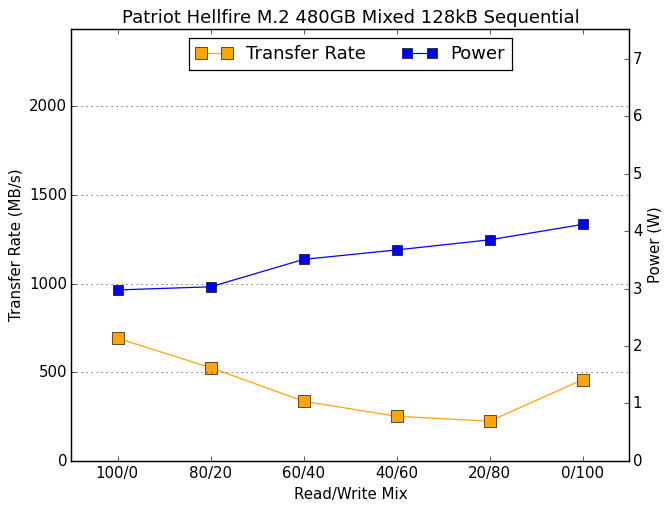
Mixed Sequential Read/Write Performance
The mixed sequential access test covers the entire span of the drive and uses a queue depth of one. It starts with a pure read test and gradually increases the proportion of writes, finishing with pure writes. Each subtest lasts for 3 minutes, for a total test duration of 18 minutes. The drive is filled before the test starts.
The Patriot Hellfire turns in the second-worst performance from a PCIe SSD, but at least it is still clearly faster than any SATA SSD. Even the 250GB Samsung 960 EVO fares better. This test is another sign that the Patriot Hellfire does poorly when full.
The Hellfire's power consumption across the mixed sequential I/O test is about average for an NVMe SSD, so its overall efficiency is fairly poor.
 |
|||||||||
The addition of a heatsink only slightly improves the minimum performance of the Patriot Hellfire across the mixed sequential I/O test, and actually led to slightly reduced performance overall.
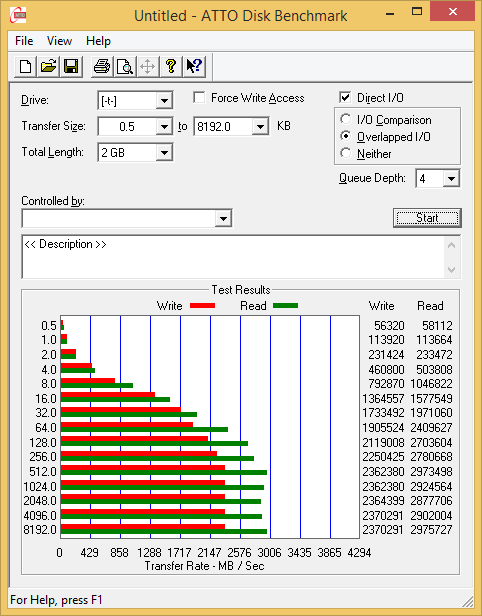
ATTO
ATTO's Disk Benchmark is a quick and easy freeware tool to measure drive performance across various transfer sizes.
 |
|||||||||
With write speeds that exceed 2.3 GB/s and read speeds that almost hit 3 GB/s, the Patriot Hellfire has no trouble delivering very high performance on shorter tests and with compressible data. Performance scales well with transfer size until around 64 kB, after which it takes quite a while for performance to fully saturate.
AS-SSD
AS-SSD is another quick and free benchmark tool. It uses incompressible data for all of its tests, making it an easy way to keep an eye on which drives are relying on transparent data compression. The short duration of the test makes it a decent indicator of peak drive performance.
The Patriot Hellfire can't quite keep up with Samsung's latest generation, but it still ties or slightly beats the rest of the competition even though the use of incompressible data slows it down some.
Idle Power Consumption
Since the ATSB tests based on real-world usage cut idle times short to 25ms, their power consumption scores paint an inaccurate picture of the relative suitability of drives for mobile use. During real-world client use, a solid state drive will spend far more time idle than actively processing commands. We report two measures of idle power consumption: active idle where the SSD is not in use but has not been put in to any low-power sleep state, and idle power consumption in the deepest sleep state supported by our testbed. For NVMe SSDs, the lowest drive power state is measured but PCIe Active State Power Management (ASPM) is not used due to limitations of this motherboard. For SATA SSDs, aggressive link power management is used to put the SATA link into slumber state. Many SSDs support a deeper DevSleep state, but this cannot be engaged using ordinary desktop platforms.
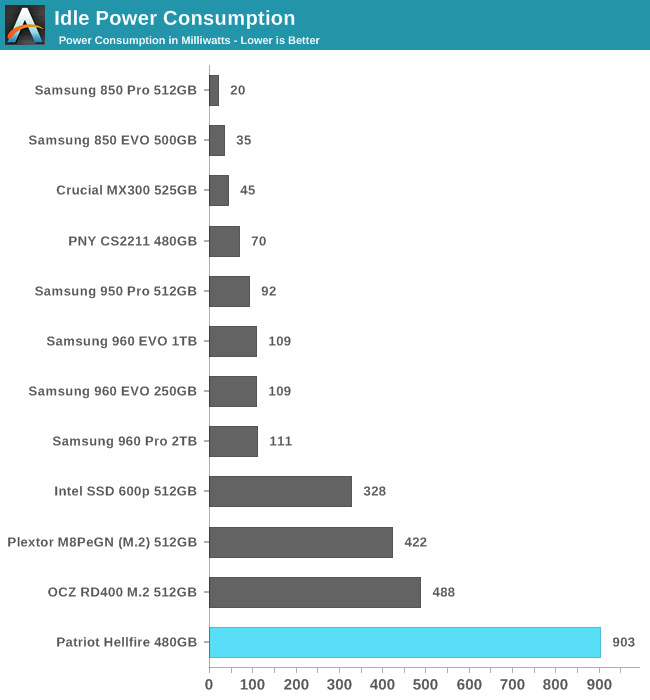
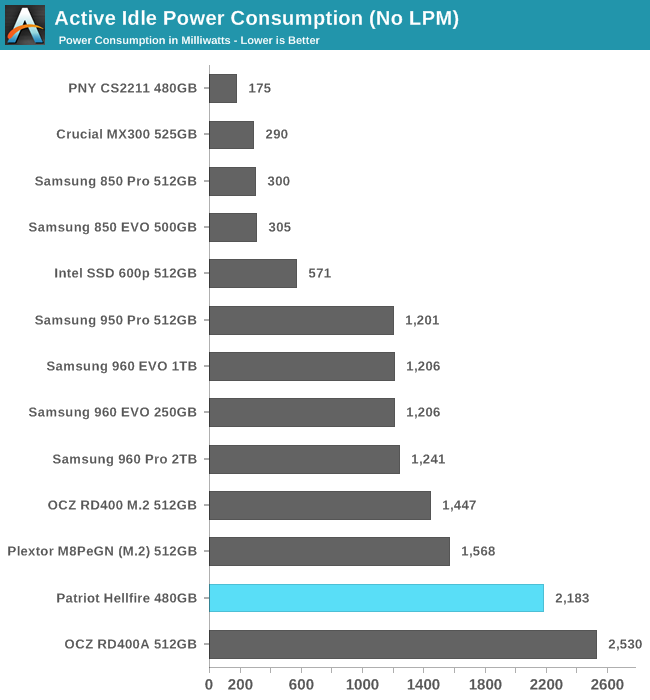
The Patriot Hellfire has by far the worst power management, and is barely able to get below 1 W even in the deepest low-power state. If NVMe power saving is not used, the Hellfire never drops below 2 W. This means the Hellfire starts out any performance test far closer to thermal throttling than any other SSD. (The OCZ RD400A is using slightly more power than the Hellfire because of the overhead of its 12V to 3.3V conversion circuit.)
Final Words
At the heart of the Patriot Hellfire is Phison's PS5007-E7 controller, their first PCIe NVMe SSD controller. Phison originally intended this to be a high-end controller, but they fell short of that mark — and they didn't just lose against Samsung's controllers. The Patriot Hellfire is the slowest MLC-based NVMe SSD we've tested. But that doesn't mean it's a slow drive overall.
Phison put a ton of effort into optimizing the firmware for the E7 controller, both before and after drives hit the market. The end result is a SSD that always outperforms even the best SATA SSD of comparable capacity. The Patriot Hellfire suffers more than its competitors when nearly full, but the performance hit isn't as large as what TLC-based SSDs show. On longer tests, the Patriot Hellfire lags behind its current competition by a bit, but often still manages to tie or outperform the older Intel SSD 750, which was for a time the fastest (and only) NVMe SSD in the consumer market. For shorter tests under more favorable (and more realistic) conditions, the Patriot Hellfire delivers great performance that is as second only to Samsung's NVMe SSDs.
Despite its imperfections, the Phison E7 controller solution is still a very impressive accomplishment as Phison's first PCIe SSD controller. The only major complaint is power consumption. The Patriot Hellfire was usually among the least efficient of the PCIe SSDs, and PCIe SSDs are already sacrificing efficiency for higher performance relative to SATA SSDs. The most egregious manifestation of this problem is the idle power usage, where the Patriot Hellfire in its lowest power state was still drawing almost twice the power of the next most power-hungry PCIe SSD, and more like 20 times the draw of a decent SATA SSD. This high power consumption not only rules out the Patriot Hellfire and other Phison E7 drives for laptop use, it means the drive is always running a bit on the warm side and is therefore that much closer to thermal throttling. While we did not find throttling to be a problem during typical real-world I/O intensity, I do not think the Patriot Hellfire would fare quite so well in a hot or poorly ventilated spot, such as in a notebook or tucked under a beefy graphics card.
The Patriot Hellfire is just one of several names that Phison's reference design is being sold under. Zotac shipped Phison's HHHL PCIe add-in card design as the Zotac Sonix, while the same M.2 PCB as the Hellfire is also being sold by PNY as the CS2030, MyDigitalSSD's BPX, and Corsair's Force MP500. With essentially the same hardware, all of these drives have the potential to perform almost identically. However, firmware matters a lot, and Patriot is the only vendor that has released a firmware update tool for their Phison E7 SSD. The pace of firmware updates from Phison has slowed down significantly compared to last summer and some of the SSDs haven't been on the market long enough to require a firmware update, but Patriot deserves credit for getting their Phison E7 SSD to market reasonably early and for recognizing that their job didn't end there.
| 128GB | 240-256GB | 400-512GB | |
| Patriot Hellfire M.2 | $129.99 (54¢/GB) | $229.99 (48¢/GB) | |
| Corsair Force MP500 | $113.43 (95¢/GB) | $254.99 (53¢/GB) | |
| PNY CS2030 | $179.99 (75¢/GB) | $332.42 (69¢/GB) | |
| MyDigitalSSD BPX | $77.43 (65¢/GB) | $114.99 (48¢/GB) | $209.81 (44¢/GB) |
| Samsung 960 EVO | $121.09 (48¢/GB) | $249.99 (50¢/GB) | |
| Samsung 960 Pro | $339.95 (66¢/GB) | ||
| Toshiba OCZ RD400A | $139.99 (109¢/GB) | $309.99 (61¢/GB) | |
| Toshiba OCZ RD400 M.2 | $119.99 (94¢/GB) | $164.81 (64¢/GB) | $289.99 (57¢/GB) |
| Intel SSD 600p | $63.99 (40¢/GB) | $98.99 (39¢/GB) | $193.34 (38¢/GB) |
| Intel SSD 750 | $325.95 (81¢/GB) | ||
| Plextor M8PeY (AIC w./ heatsink) |
$145.94 (114¢/GB) | $169.99 (66¢/GB) | $279.99 (55¢/GB) |
| Plextor M8PeGN (bare M.2) |
$95.94 (75¢/GB) | $141.72 (55¢/GB) | $265.86 (52¢/GB) |
| Samsung 850 Pro | $129.99 (51¢/GB) | $237.99 (46¢/GB) | |
| Samsung 850 EVO | $98.00 (39¢/GB) | $159.99 (32¢/GB) |
The pricing of the Patriot Hellfire doesn't hold up against the MyDigitalSSD BPX, the cheapest Phison E7 SSD on the market. The latter also offers a 5 year warranty instead of Patriot's 3, which makes the Hellfire a tougher sell for Patriot. Looking outside the Phison club, the Samsung 960 EVO is the next more expensive SSD.
We unfortunately have not had the chance to test the 500 GB 960 EVO, but based on our results with the 250GB and the 1TB, we can draw a few conclusions. First, the superiority of Samsung's controller and 3D NAND means that it's almost untouchable in some synthetic benchmarks. On the other hand, under a sustained write test the 960 EVO's SLC cache will fill up and performance will tank. This is not representative of most real-world workloads and is not reason to disqualify the 960 EVO. In our lightest test of real-world I/O, even the 250GB 960 EVO outperforms the 480GB Patriot Hellfire. For all but the most intense workloads, Samsung's SLC caching will provide better real-world performance than the MLC+Phison combination. And the Samsung drive will draw less power and run cooler while outperforming the Patriot Hellfire.
At current pricing, a Phison E7 SSD might make sense at the 120 GB capacity point where Samsung has no offering, or at higher capacities for workloads that don't play nice with SLC caching. But for the latter, the Plextor M8Pe probably makes more sense. And I'm not sure a 120 GB PCIe SSD makes any sense at all, when a 250 GB 850 EVO is in the same ballpark. The Patriot Hellfire didn't react all that well to being filled, and 120 GB gets crowded fast.


