Original Link: https://www.anandtech.com/show/10234/the-pny-cs1311-and-cs2211-ssd-review-mlc-vs-tlc-at-15nm
The PNY CS1311 and CS2211 SSD Review: MLC vs TLC at 15nm
by Billy Tallis on April 15, 2016 8:00 AM EST
Phison's S10 SATA SSD controller has taken over a large chunk of the SSD market. It works with both MLC and TLC and is sold as part of an off-the-shelf SSD solution that allows companies to purchase complete drives with the controller, NAND (from Toshiba), and firmware, awaiting only branding. Many companies that formerly developed and manufactured their own drives based on controllers from the likes of SandForce have switched over to Phison's platform, saving lots on R&D but sacrificing almost all opportunities for product differentiation. The most recent entrants in the SSD market only came into being because Phison made it so accessible. Even Toshiba, with their large resources, has adopted the Phison S10 as the heart of their TC58 controller used in the Q300 and OCZ's Trion product line.
The latest member to join the Phison legion - and the subject of today's review - is PNY. PNY's latest refresh of their consumer SSDs has shifted their product lines entirely over to the latest iteration of Phison S10 platform. In focusing their lineup around the S10 platform, the company has introduced two new drives: the CS1311 and the CS2211. The CS1311 is the entry-level model of their refreshed lineup and uses Toshiba's 15nm TLC NAND. Meanwhile the CS2211 is the performance-oriented model with their XLR8 (accelerate...) branding, and uses Toshiba's 15nm MLC.
| PNY CS1311 Specifications | |||||
| Capacity | 120GB | 240GB | 480GB | ||
| Controller | Phison PS3110-S10C-12 | Phison PS3110-S10-X | |||
| NAND | Toshiba 15nm TLC | ||||
| Sequential Read | 550MB/s | 550MB/s | 550MB/s | ||
| Sequential Write | 510MB/s | 520MB/s | 520MB/s | ||
| 4KB Random Read | 86K IOPS | 87K IOPS | 90K IOPS | ||
| 4KB Random Write | 90K IOPS | 90K IOPS | 90K IOPS | ||
| Idle Power | 170mW | ||||
| Active Power | 2.2W | ||||
| Warranty | Three years | ||||
| Price (Amazon) | $39.99 | $59.99 | $109.99 | ||
| PNY CS2211 XLR8 Specifications | ||||
| Capacity | 240GB | 480GB | ||
| Controller | Phison PS3110-S10C-12 | Phison PS3110-S10-X | ||
| NAND | Toshiba 15nm MLC | |||
| Sequential Read | 560MB/s | 565MB/s | ||
| Sequential Write | 470MB/s | 540MB/s | ||
| 4KB Random Read | 87K IOPS | 95K IOPS | ||
| 4KB Random Write | 95K IOPS | 95K IOPS | ||
| Idle Power | 200mW | |||
| Active Power | 3.3W | |||
| Warranty | Four years | |||
| Price (Amazon) | $84.96 | $134.96 | ||
As the latest S10 based drives to hit the market, the specifications and expected performance of the CS1311 and CS2211 should not surprise anyone. With very limited room to differentiate through firmware, the two drives should perform very similar to the drives we've looked at in the past.
But unlike other vendors' lineups, PNY's S10-based lineup gives us the interesting opportunity to make a direct comparison between MLC and TLC on the Phison S10 platform. With the same PCBs and the same controller, the CS1311 and CS2211 differ only in the choice of flash and the firmware. This is perhaps our best chance to compare MLC and TLC to date; In the past we've been able to compare Samsung's flash with close relatives like the 850 Pro vs the 850 EVO, but never with two drives quite so similar as the PNY S10 drives. The end result is that although this won't quite be an apples-to-apples comparison since we can't rule out the impact of firmware - the performance and endurance characteristics of TLC means that it's not treated exactly like MLC - but we are nonetheless getting a unique look at NAND performance on identical platforms.
Taking a look at our individual drives then, it is interesting to note that the standard Phison S10 drive has undergone significant physical changes since our first encounter with it via the Corsair Neutron XT. The case still consists of two metal parts that snap together, but they now interlock more at the edges instead of the top piece encircling all four sides. Inside we find PCBs with a familiar layout save for two major changes. As with the transition from OCZ's Trion 100 to the Trion 150, we find that the 15nm NAND is in TSOP packages where the earlier drives with A19nm NAND used BGA packages for the flash.
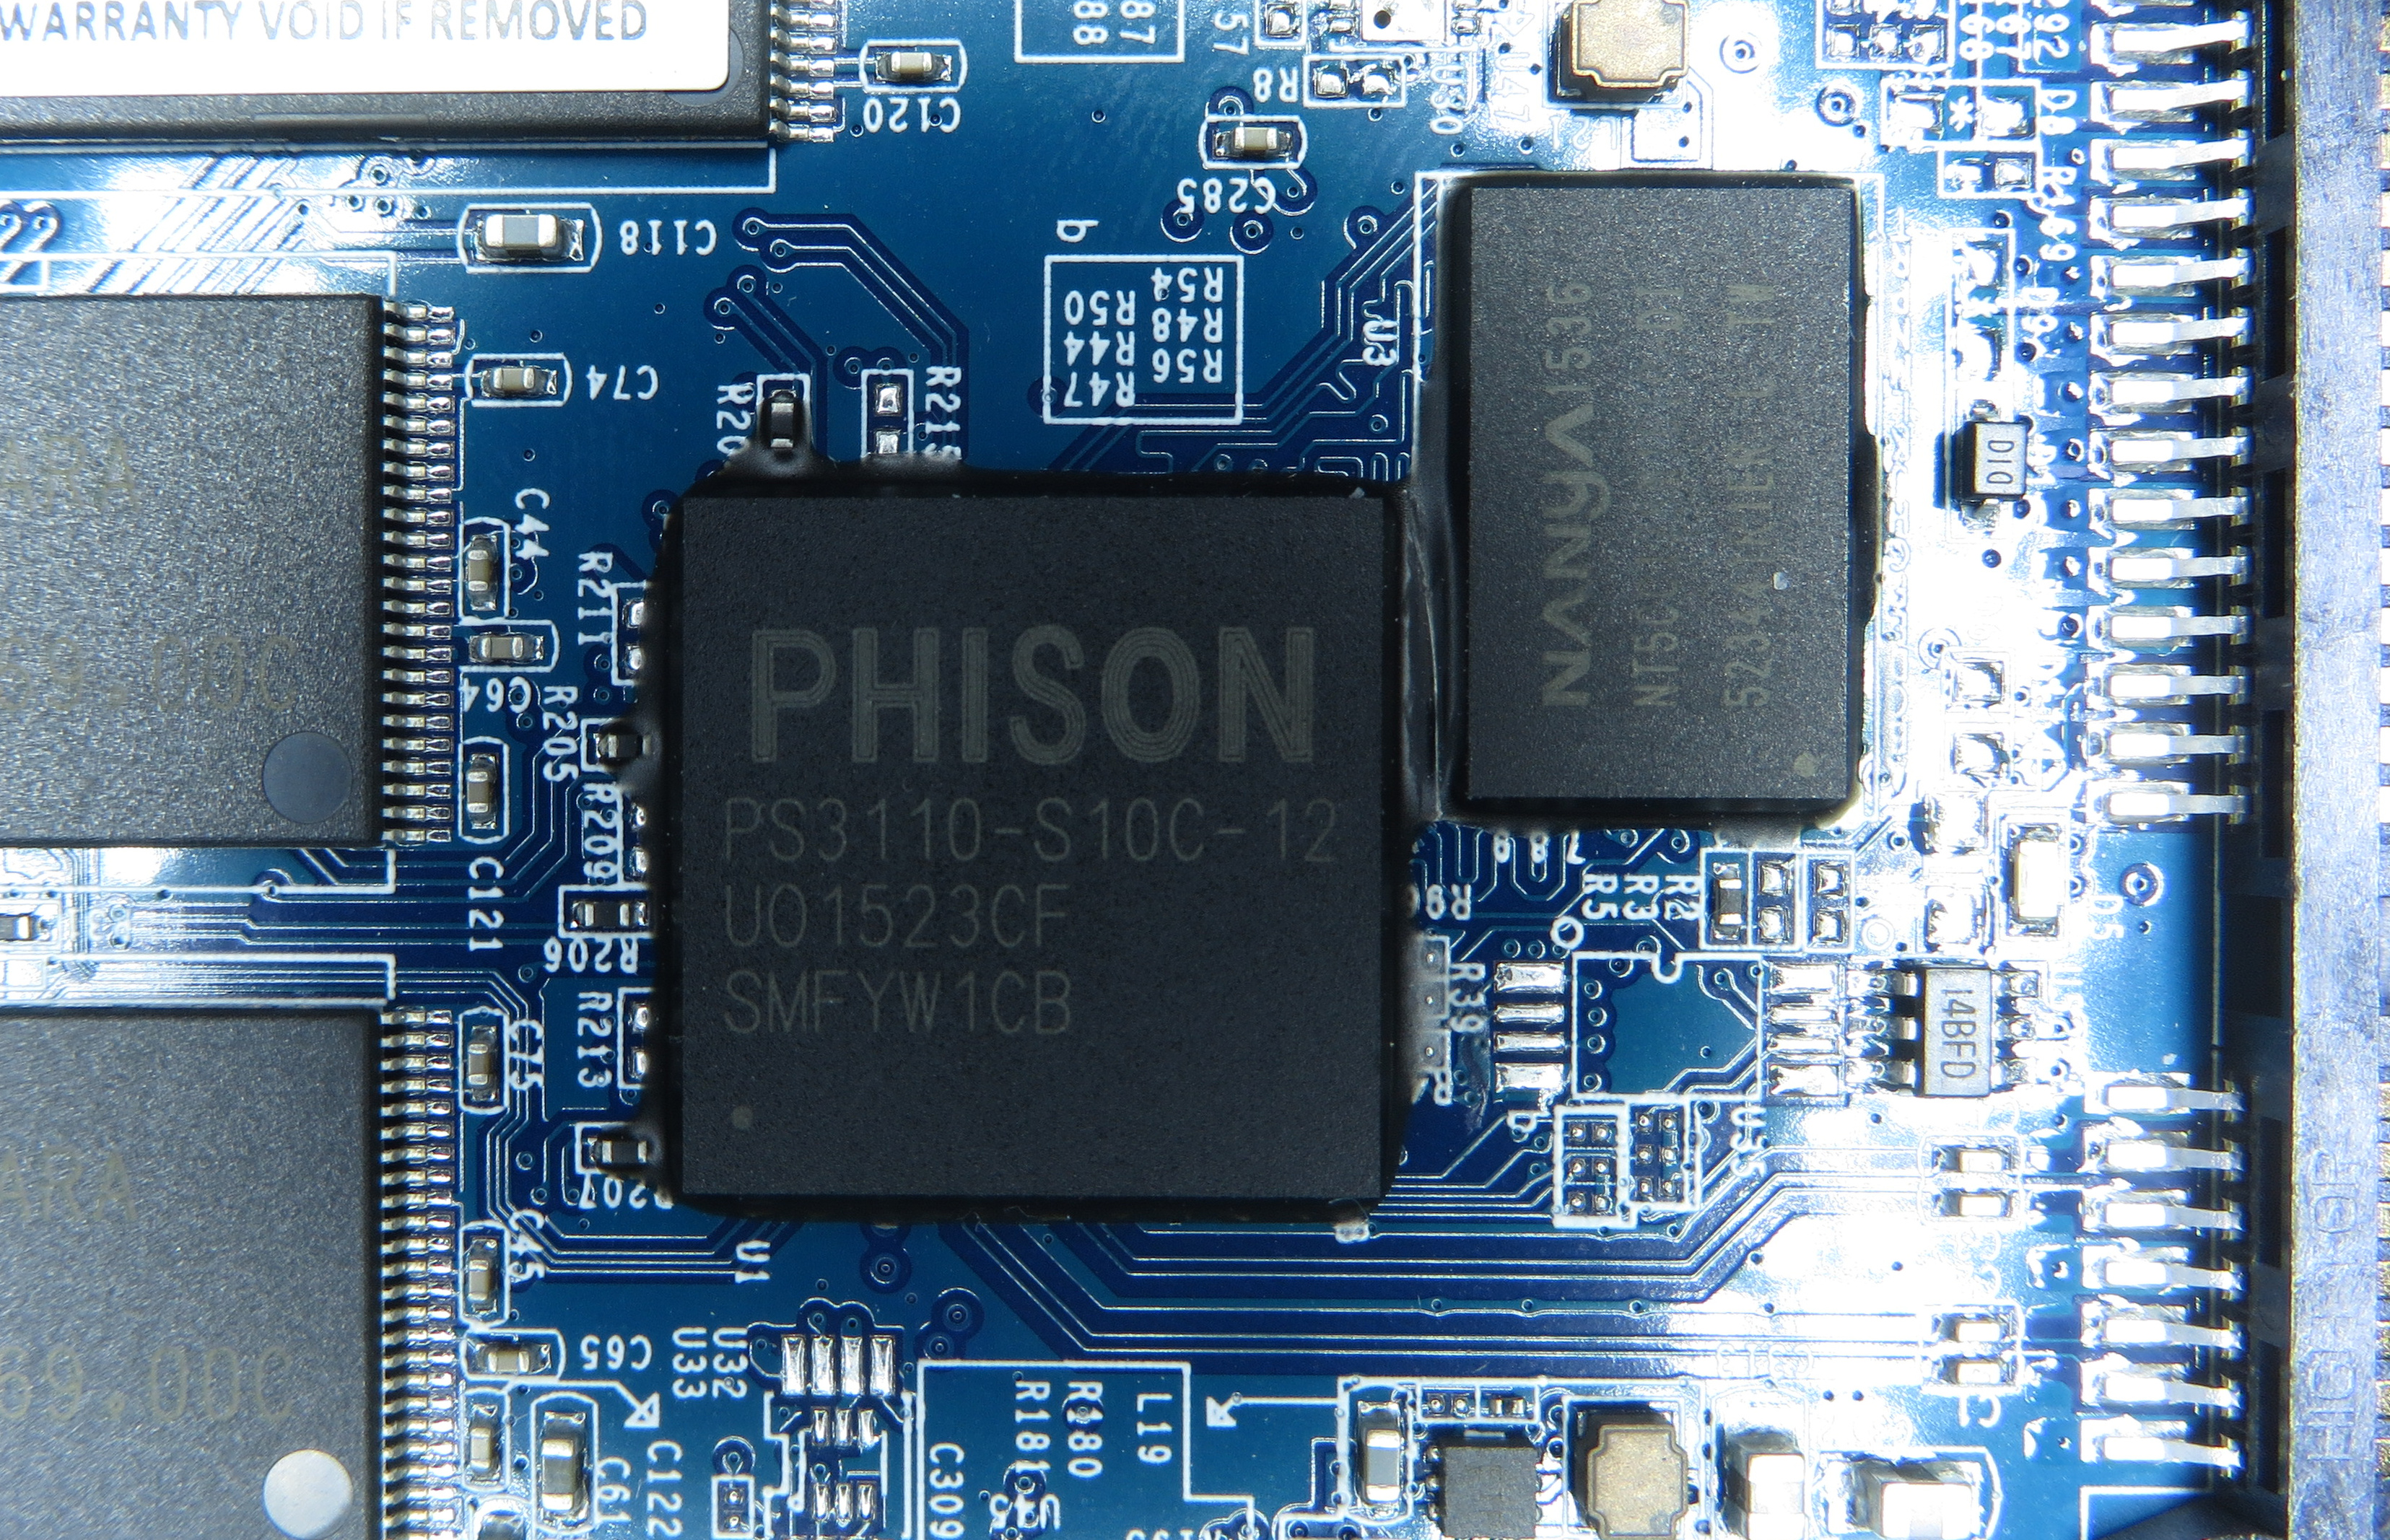
The bigger change is that the 120GB and 240GB drives are using a smaller variant of the S10 controller. The full-size controller we're familiar with is the PS3110-S10-X, and the newcomer is the PS3110-S10C-12. The S10C has only four NAND channels instead of eight, and the PCB for that variant only has space for one DRAM chip rather than one on each side as found with S10-X. This narrowing of interfaces has the potential to introduce bottlenecks, but this is only being done for the two smallest capacities that would have trouble fully exploiting the parallelism available from the larger controller.
The last hardware change of note is that the controller and DRAM chips on the CS2211 sealed around the edges with a soft potting compound. I'm told this will be rolling out to other S10 products.


Both model lines are priced attractively. Of current-generation drives, the CS1311 competes against the likes of ADATA's SP550 and OCZ's Trion 150, plus lingering supply of older drives with 19+nm TLC NAND. The CS2211 competes against drives like Crucial's MX200, Samsung's 850 EVO, and the various MLC drives with Silicon Motion's SM2246EN controller (eg. Mushkin Reactor, Crucial BX100).
| AnandTech 2015 SSD Test System | |
| CPU | Intel Core i7-4770K running at 3.5GHz (Turbo & EIST enabled, C-states disabled) |
| Motherboard | ASUS Z97 Deluxe (BIOS 2501) |
| Chipset | Intel Z97 |
| Memory | Corsair Vengeance DDR3-1866 2x8GB (9-10-9-27 2T) |
| Graphics | Intel HD Graphics 4600 |
| Desktop Resolution | 1920 x 1200 |
| OS | Windows 8.1 x64 |
- Thanks to Intel for the Core i7-4770K CPU
- Thanks to ASUS for the Z97 Deluxe motherboard
- Thanks to Corsair for the Vengeance 16GB DDR3-1866 DRAM kit, RM750 power supply, Carbide 200R case, and Hydro H60 CPU cooler
Performance Consistency
Our performance consistency test explores the extent to which a drive can reliably sustain performance during a long-duration random write test. Specifications for consumer drives typically list peak performance numbers only attainable in ideal conditions. The performance in a worst-case scenario can be drastically different as over the course of a long test drives can run out of spare area, have to start performing garbage collection, and sometimes even reach power or thermal limits.
In addition to an overall decline in performance, a long test can show patterns in how performance varies on shorter timescales. Some drives will exhibit very little variance in performance from second to second, while others will show massive drops in performance during each garbage collection cycle but otherwise maintain good performance, and others show constantly wide variance. If a drive periodically slows to hard drive levels of performance, it may feel slow to use even if its overall average performance is very high.
To maximally stress the drive's controller and force it to perform garbage collection and wear leveling, this test conducts 4kB random writes with a queue depth of 32. The drive is filled before the start of the test, and the test duration is one hour. Any spare area will be exhausted early in the test and by the end of the hour even the largest drives with the most overprovisioning will have reached a steady state. We use the last 400 seconds of the test to score the drive both on steady-state average writes per second and on its performance divided by the standard deviation.
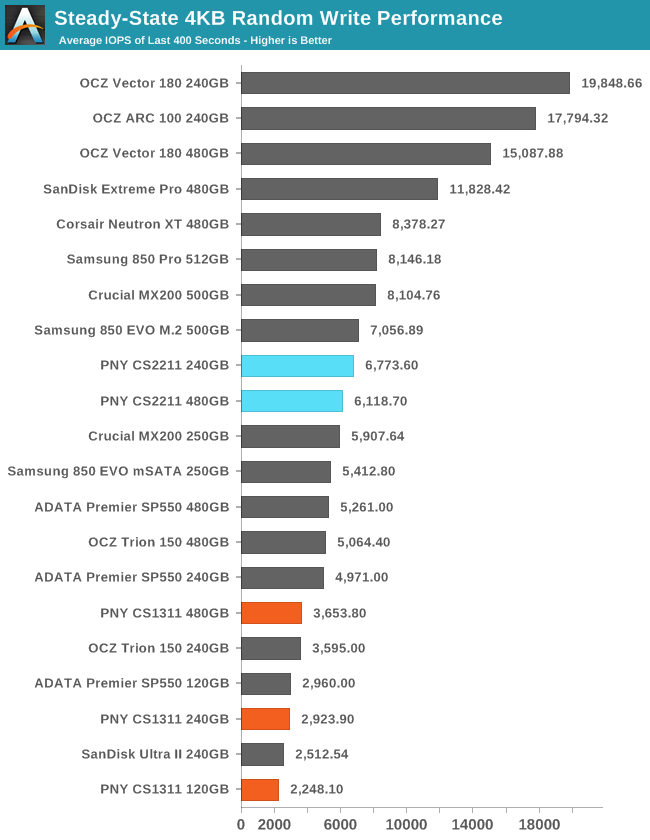
Among TLC drives, the ADATA SP550 and OCZ Trion 150 both soundly outperform the PNY CS1311 in sustained random writes. The PNY CS2211 performs well enough for a cheap MLC drive, but is also significantly behind the earlier Phison-based Neutron XT. The gap between the CS2211 and the CS1311 is clear, but there are other MLC and TLC drives blurring that line.
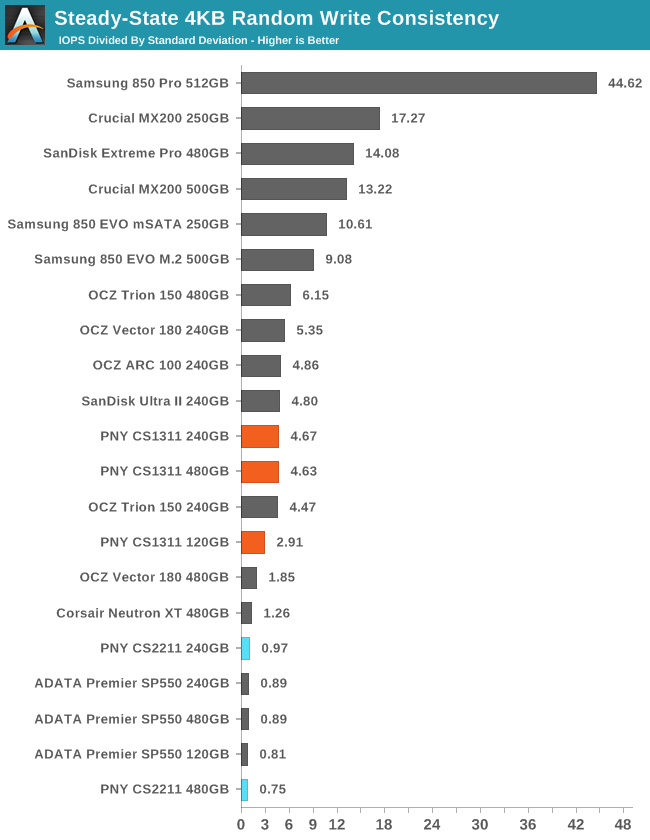
The CS1311's consistency score is decent despite the low overall random write performance. The CS2211 has a very low consistency score, indicating that there's a major difference in firmware between the two models. We would normally expect ongoing garbage collection to be easier for a MLC drive, especially one with as much spare area as a typical TLC drive.
 |
|||||||||
| Default | |||||||||
| 25% Over-Provisioning | |||||||||
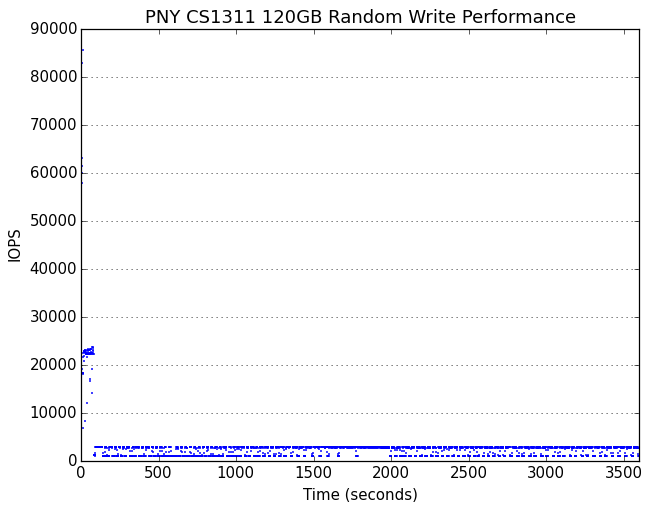
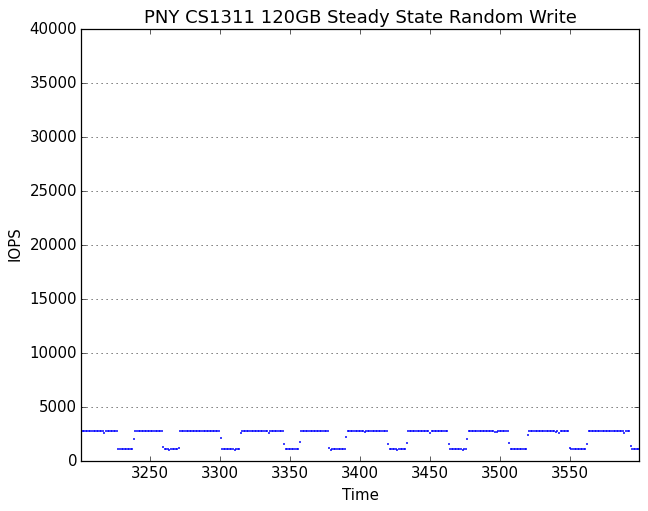
The difference in behavior between the the CS1311 and CS2211 is very clear. The TLC-based CS1311 has the tight regulation of performance we saw on the OCZ Trion 150 while the MLC-based CS2211 behaves like earlier Phison-based drives by having a solid baseline with widely varying performance above that.
 |
|||||||||
| Default | |||||||||
| 25% Over-Provisioning | |||||||||
The 240GB CS1311 and 240GB Trion 150 alternate between the same two performance states, but the Trion 150 spends a far larger portion of its time in the higher performance state. At the 480GB capacity, the Trion 150's slower performance state is the CS1311's faster state.
The CS1311 responds better to overprovisioning than the CS2211, leading to the 480GB CS1311 providing a steady 10k IOPS while the CS2211 varies from 3k to 27k IOPS.
AnandTech Storage Bench - The Destroyer
The Destroyer is an extremely long test replicating the access patterns of very IO-intensive desktop usage. A detailed breakdown can be found in this article. Like real-world usage and unlike our Iometer tests, the drives do get the occasional break that allows for some background garbage collection and flushing caches, but those idle times are limited to 25ms so that it doesn't take all week to run the test.
We quantify performance on this test by reporting the drive's average data throughput, a few data points about its latency, and the total energy used by the drive over the course of the test.
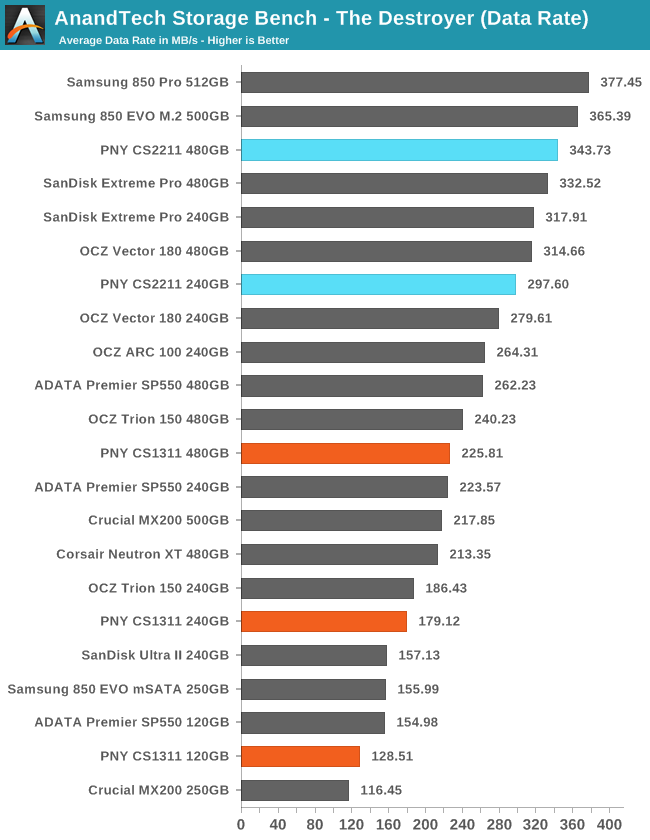
The PNY CS2211's average data rate on The Destroyer can't quite match what Samsung's 850 Pro and EVO deliver, but it trades blows with SanDisk's Extreme Pro and is a huge improvement over the Corsair Neutron XT. The CS1311 falls behind both the OCZ Trion 150 and the ADATA SP550.
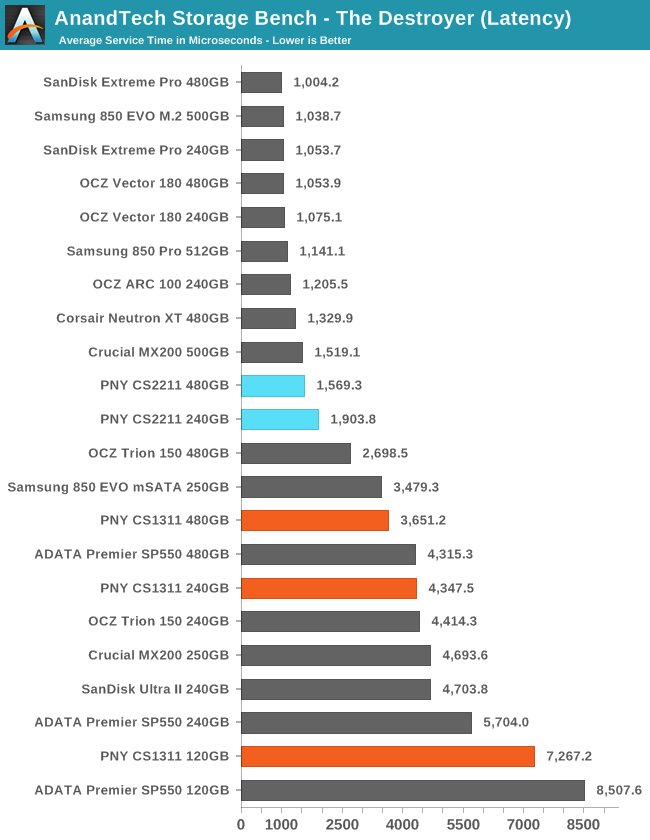
The average service time of the CS2211 is at the bottom of the normal range for most MLC drives. The CS1311 has a clear advantage over the SP550 and also manages to tie the Trion 150 at 240GB, but still shows twice the latency of the CS2211.
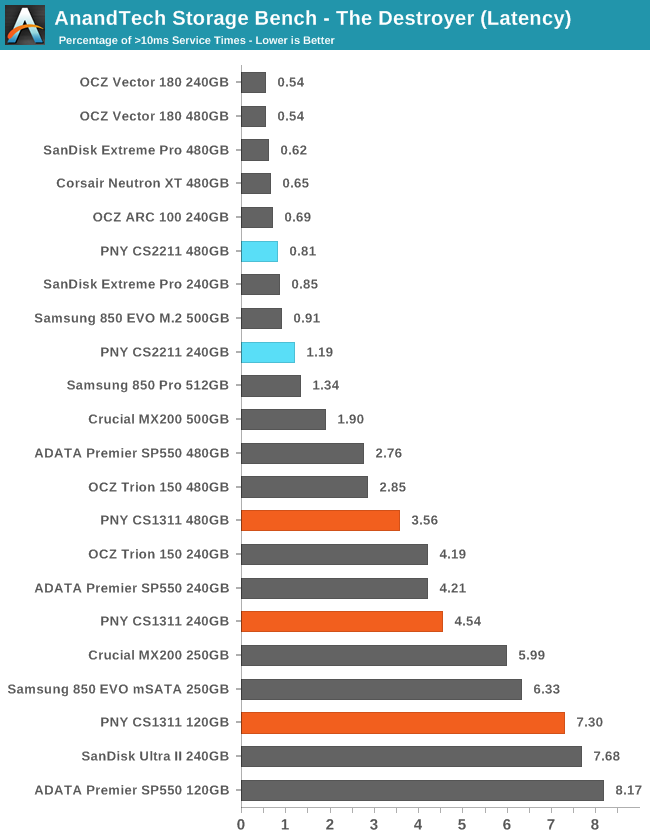
The latency outliers above the 10ms threshold are unremarkable for the CS2211. The CS1311 falls significantly significantly behind the SP550 and Trion 150 except at 120GB where the CS1311 beats the SP550 (but both 120GB drives are pretty much overwhelmed by The Destroyer).
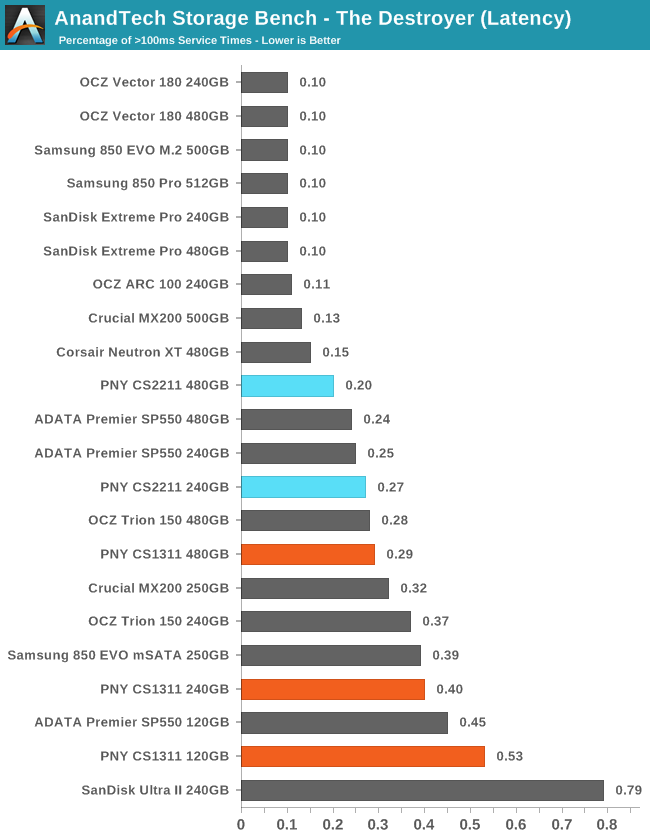
With a 100ms threshold for latency outliers, the total spread of scores is a bit smaller and the CS2211 is no longer in the top tier. The 240GB CS2211 is even a little bit slower than the 240GB SP550, which shows that using MLC flash isn't all there is to delivering good performance.
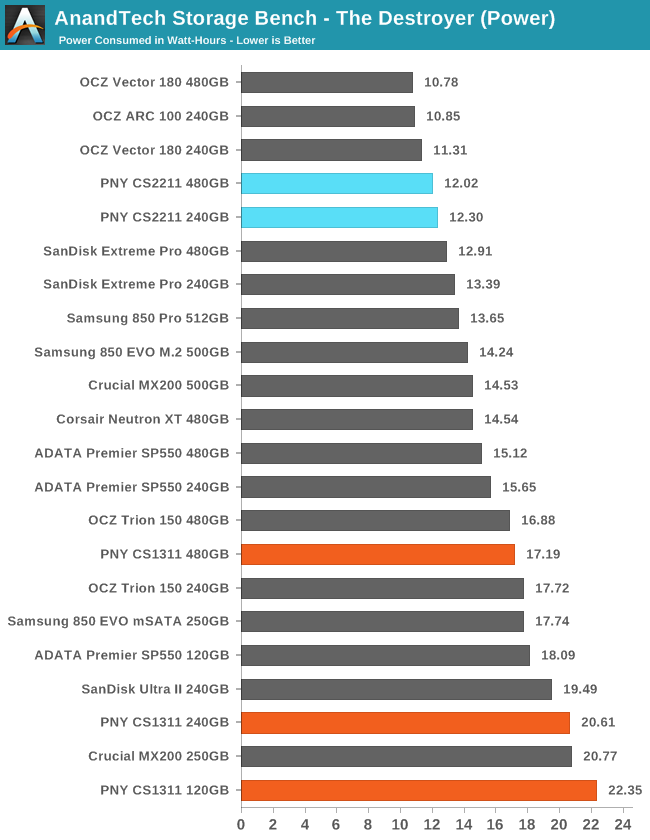
Power usage of the CS2211 is pretty good, as only drives based on Silicon Motion's SM2246EN controller or OCZ's Barefoot 3 controller use less energy over the course of the test. The low performance of the CS1311 puts it at or near the bottom for each capacity.
AnandTech Storage Bench - Heavy
Our Heavy storage benchmark is proportionally more write-heavy than The Destroyer, but much shorter overall. The total writes in the Heavy test aren't enough to fill the drive, so performance never drops down to steady state. This test is far more representative of a power user's day to day usage, and is heavily influenced by the drive's peak performance. The Heavy workload test details can be found here.
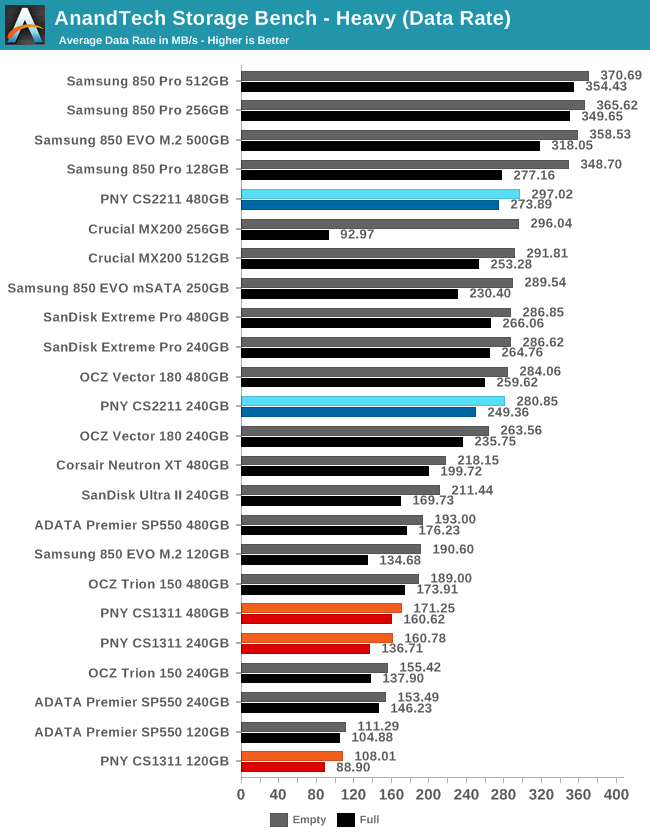
The CS2211 drives both perform well overall and are bracketing a tight cluster of drives that perform similarly, though some of the competitors don't handle a full drive as well as the CS2211 does. The 240GB CS1311 is roughly tied with its competition while the other two capacities are clearly behind, though not by an embarrassing margin. On such a write-heavy test, it's no big surprise to see the MLC drives running 70% faster than the equivalent planar TLC drive.
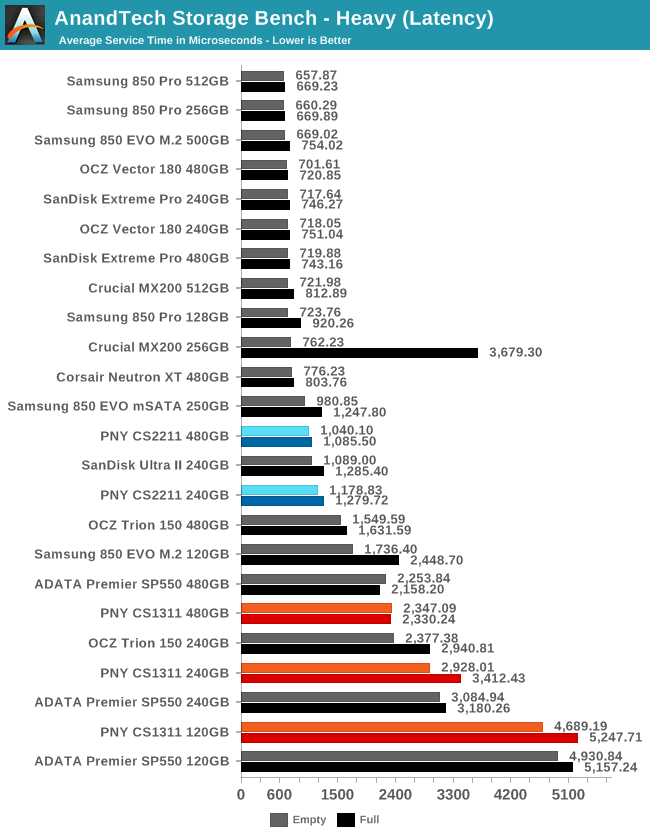
Average service time isn't a strength of either PNY model. The CS2211 is the slowest MLC drive in this bunch, and the CS1311 is the slowest of the lot when full. At 480GB the OCZ Trion 150 retains a clear lead over the other planar TLC drives.
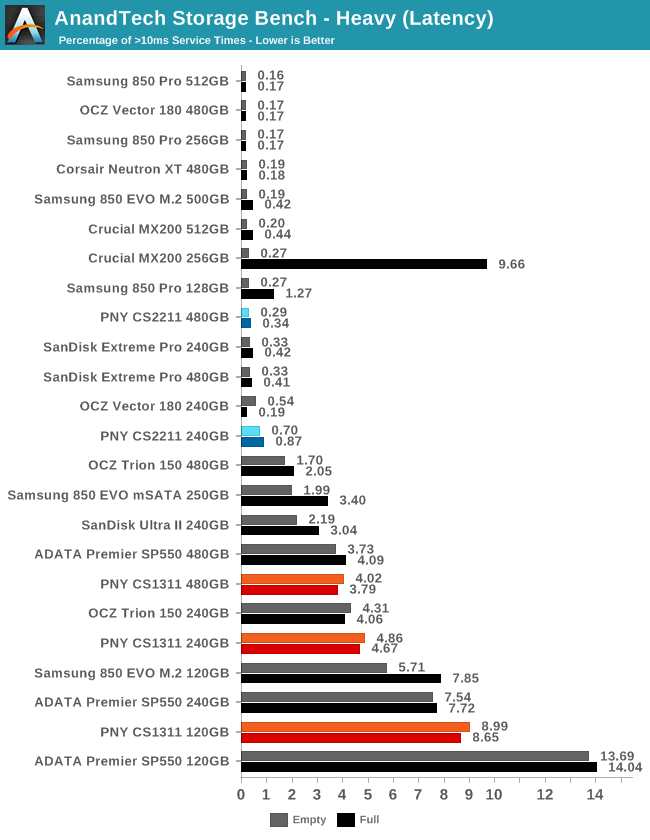
The latency outliers above 10ms put the CS2211 in a favorable light while the CS1311 mostly performs better than the ADATA SP550 but worse than the Trion 150. The huge gap between PNY's MLC and TLC models shows how a write-heavy workload can burn through a drive's pseudo-SLC cache and make TLC's weaknesses felt.
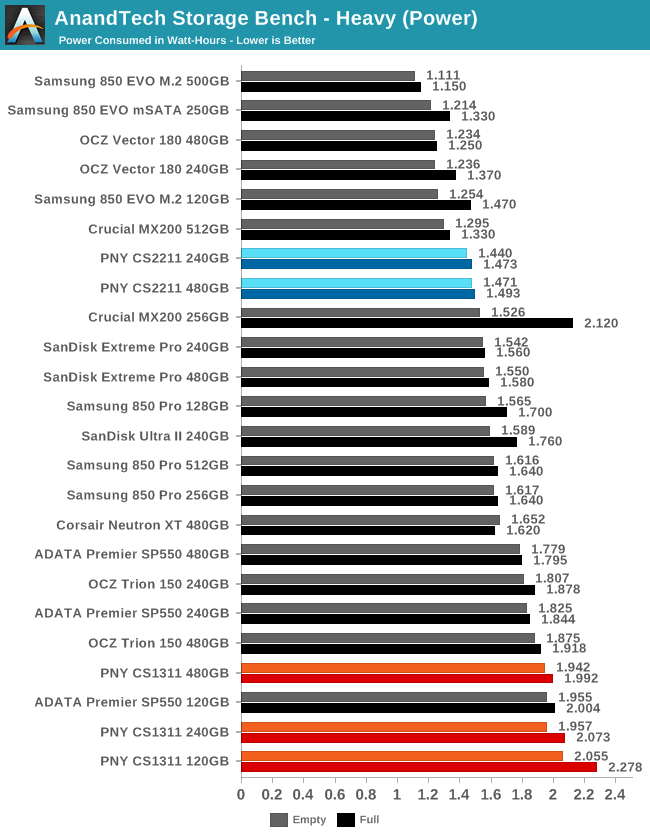
The CS1311's power efficiency is worse than almost everything else, but not horrendously so. The CS2211 is about average. The gap beterrn the 15/16nm TLC drives and the rest of the field is small but clear.
AnandTech Storage Bench - Light
Our Light storage test has relatively more sequential accesses and lower queue depths than The Destroyer or the Heavy test, and it's by far the shortest test overall. It's based largely on applications that aren't highly dependent on storage performance, so this is a test more of application launch times and file load times. This test can be seen as the sum of all the little delays in daily usage, but with the idle times trimmed to 25ms it takes less than half an hour to run. Details of the Light test can be found here.
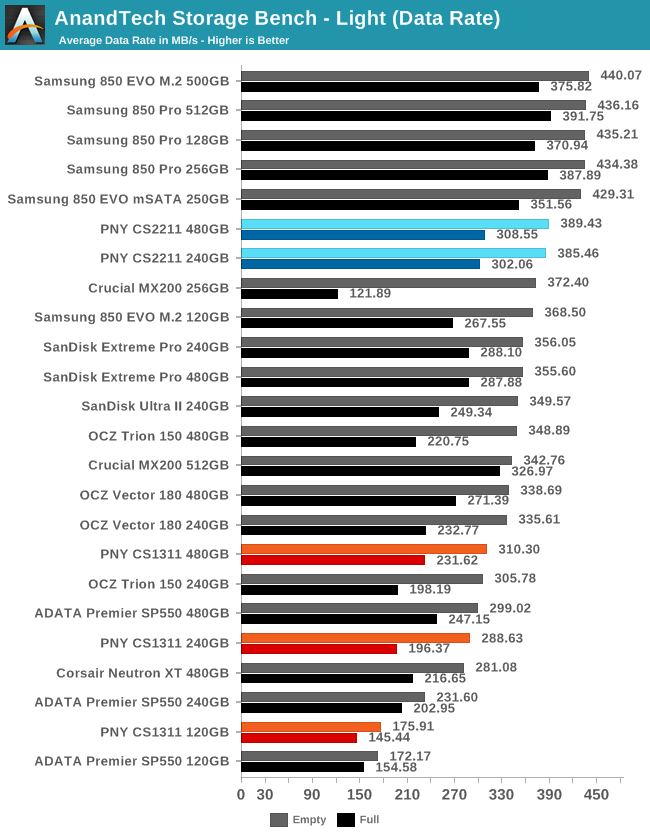
The average data rates on the Light test don't show a clear separation between MLC and TLC drives; only a handful of drives stand out with particularly low performance, mostly due to being small TLC drives. Full drive performance reveals more interesting differences than the empty drive performance. The CS2211 pays one of the largest full-drive penalties among MLC drives. In the TLC segment, the OCZ Trion 150 holds that distinction, but it starts with high enough performance when empty that it generally remains faster than the CS1311.
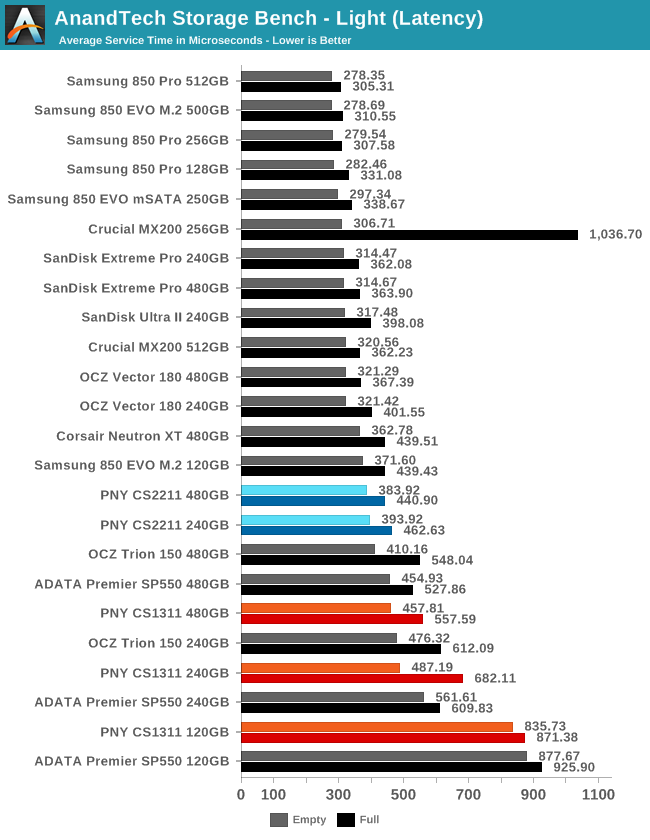
The CS2211 again has the slowest average service times of all MLC drives, but with only a moderate gap between it and the others. The CS1311 is roughly tied with the ADATA SP550 and slower than the Trion 150.
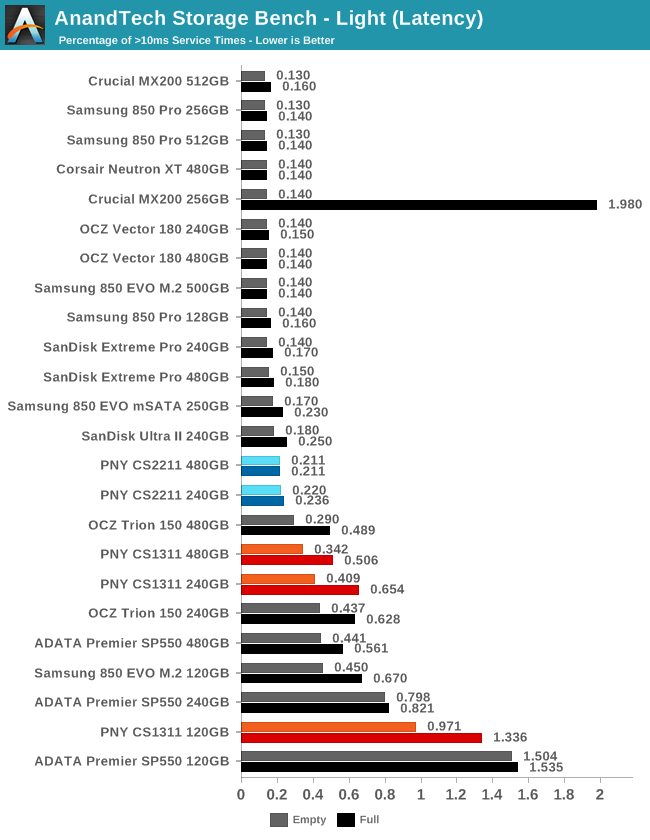
The rankings of the PNY drives going by latency outliers are similar to the rankings for average service time. None of the drives are truly overwhelmed by the Light test, but the smaller capacities of the CS1311 do suffer significantly from a full drive.
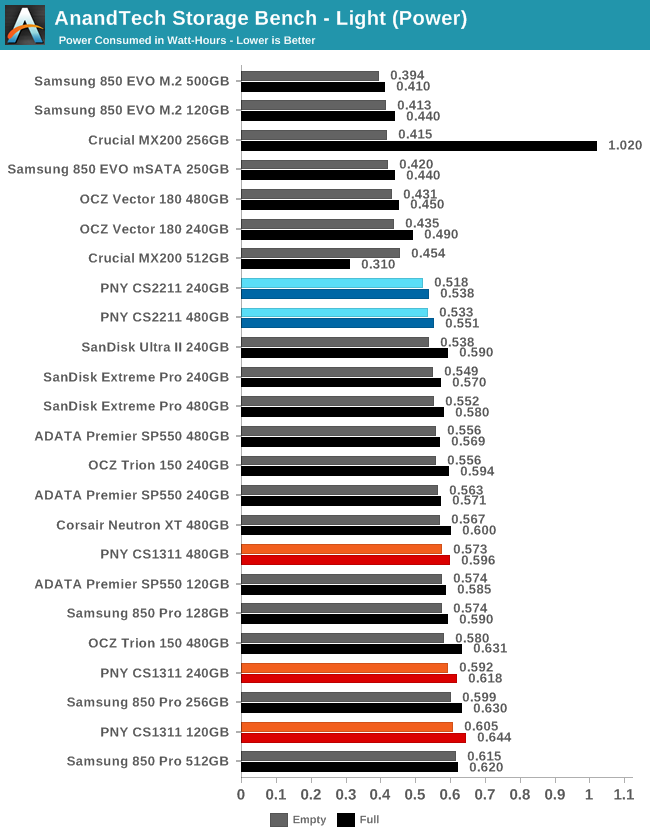
The power consumption over the course of the Light test does little to distinguish any of the drives. On light workloads, the idle power will matter more than the figures reported here. That said, it is interesting that the 240GB CS2211 comes out slightly ahead despite being slower than the 480GB CS2211. The smaller 4-channel S10 controller may be saving a bit of power over the full size.
Random Read Performance
The random read test requests 4kB blocks and tests queue depths ranging from 1 to 32. The queue depth is doubled every three minutes, for a total test duration of 18 minutes. The test spans the entire drive, which is filled before the test starts. The primary score we report is an average of performances at queue depths 1, 2 and 4, as client usage typically consists mostly of low queue depth operations.
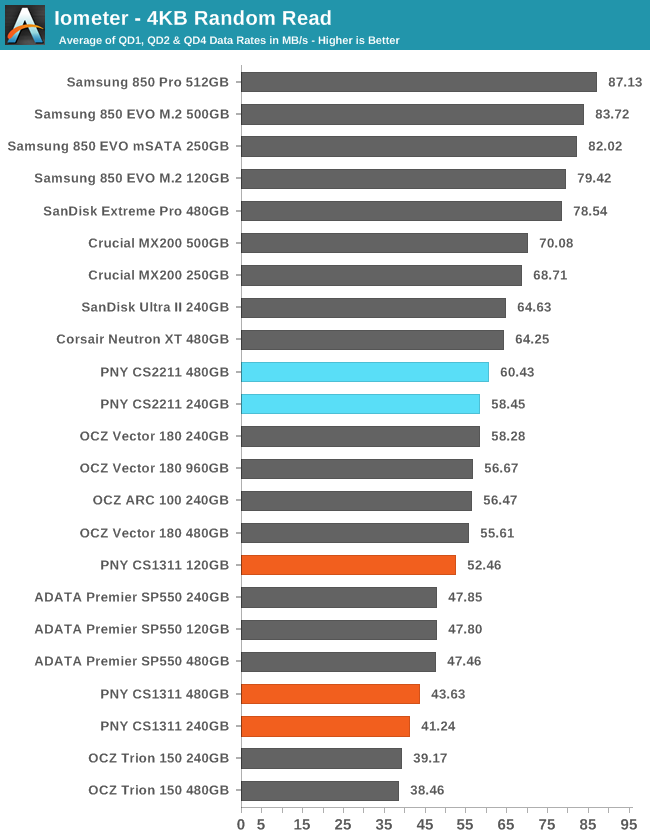
The random read performance of the CS1311 is surprising. The 120GB outperforms most other planar TLC drives, and the larger capacities clearly outperform the OCZ Trion 150. The performance of the CS2211 is mediocre by MLC standards but still significantly better than the planar TLC drives.
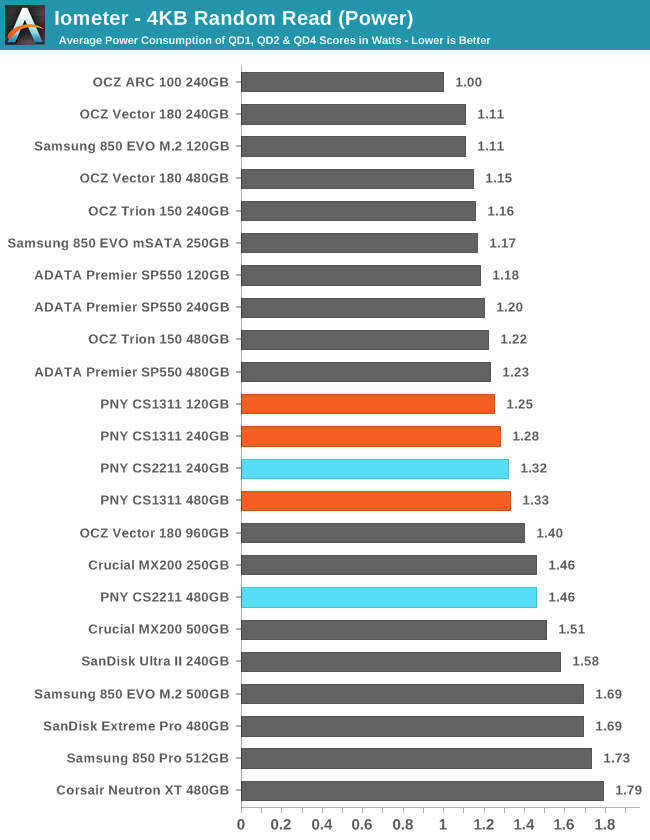
The PNY drives show a clear pattern to the power consumption: reading from more flash chips takes more power, and since read operations aren't much more power-hungry on TLC than MLC, the higher performance of MLC leads to higher power consumption.
 |
|||||||||
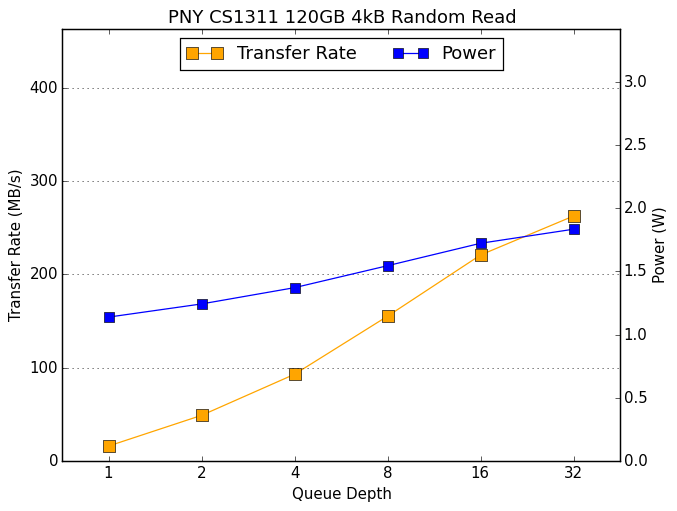
The 120GB CS1311 scales better in both power and performance than its larger counterparts, while the relation between the 240GB and 480GB is more typical. The CS2211 demonstrates significantly higher power consumption for the 480GB across the board for little performance benefit.
Random Write Performance
The random write test writes 4kB blocks and tests queue depths ranging from 1 to 32. The queue depth is doubled every three minutes, for a total test duration of 18 minutes. The test is limited to a 16GB portion of the drive, and the drive is empty save for the 16GB test file. The primary score we report is an average of performances at queue depths 1, 2 and 4, as client usage typically consists mostly of low queue depth operations.
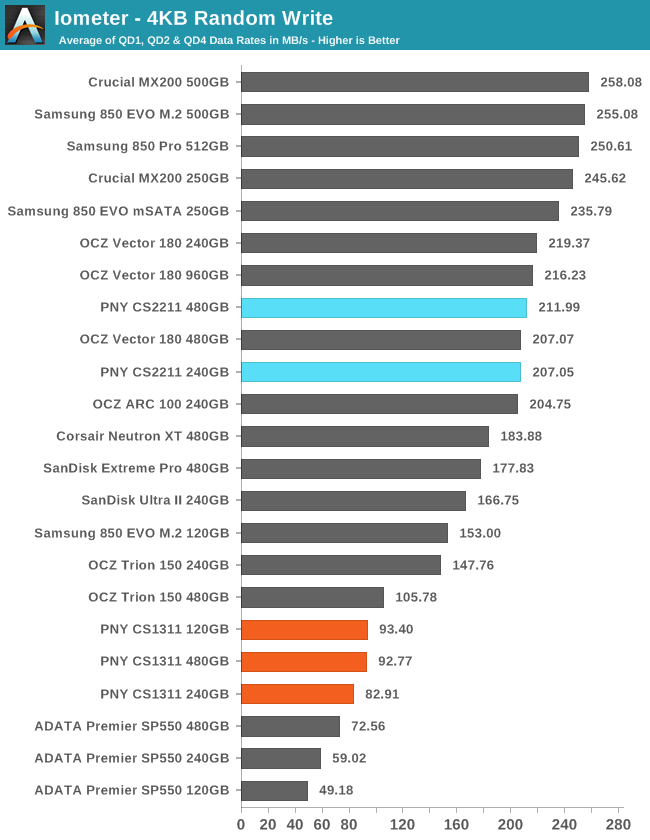
On the random write test, the 120GB CS1311 again shows higher performance than its higher capacity counterparts, but by a very slim margin. The CS2211s are quite close in performance to each other and to other mid-range MLC drives. PNY's MLC drive sustains more than twice the throughput of their TLC drive.
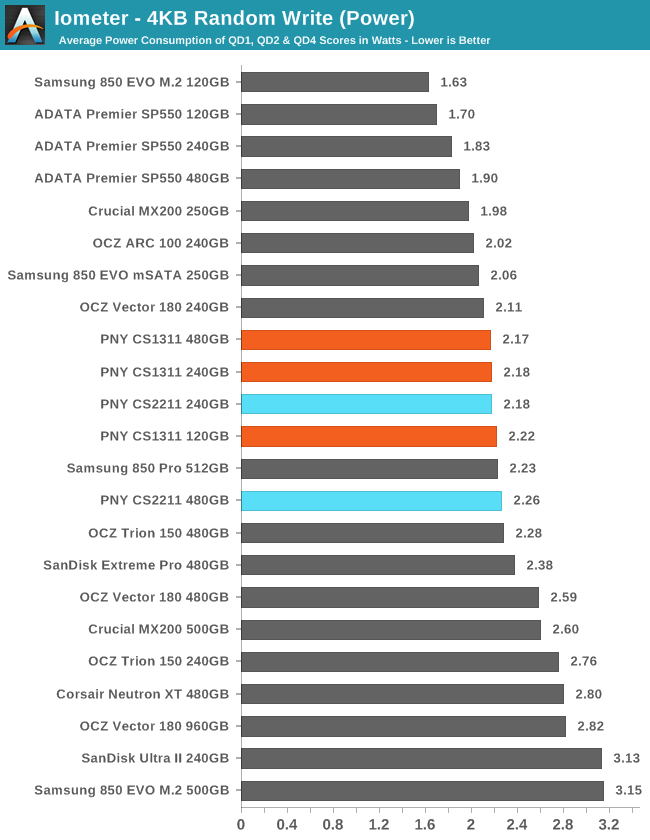
Power consumption during random writes is very similar across all the PNY drives, showing that the higher per-operation power cost on TLC is roughly matched by the higher throughput of MLC.
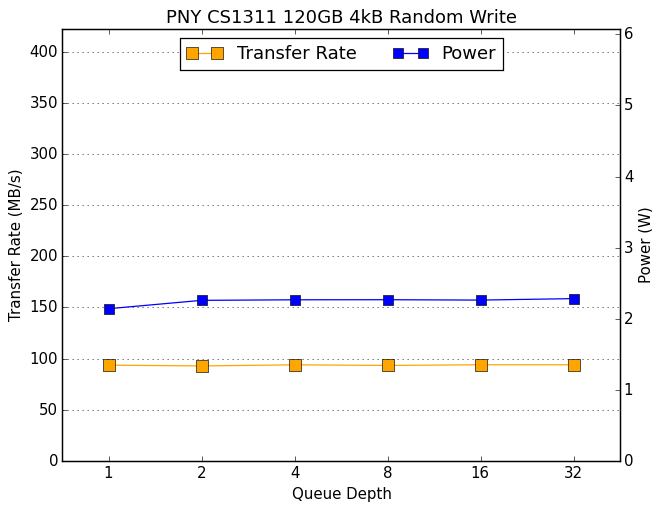 |
|||||||||
The CS1311 shows little to no performance scaling with higher queue depths, although power consumption does increase slightly. The CS2211 plateaus once the queue depth reaches eight.
Sequential Read Performance
The sequential read test requests 128kB blocks and tests queue depths ranging from 1 to 32. The queue depth is doubled every three minutes, for a total test duration of 18 minutes. The test spans the entire drive, and the drive is filled before the test begins. The primary score we report is an average of performances at queue depths 1, 2 and 4, as client usage typically consists mostly of low queue depth operations.
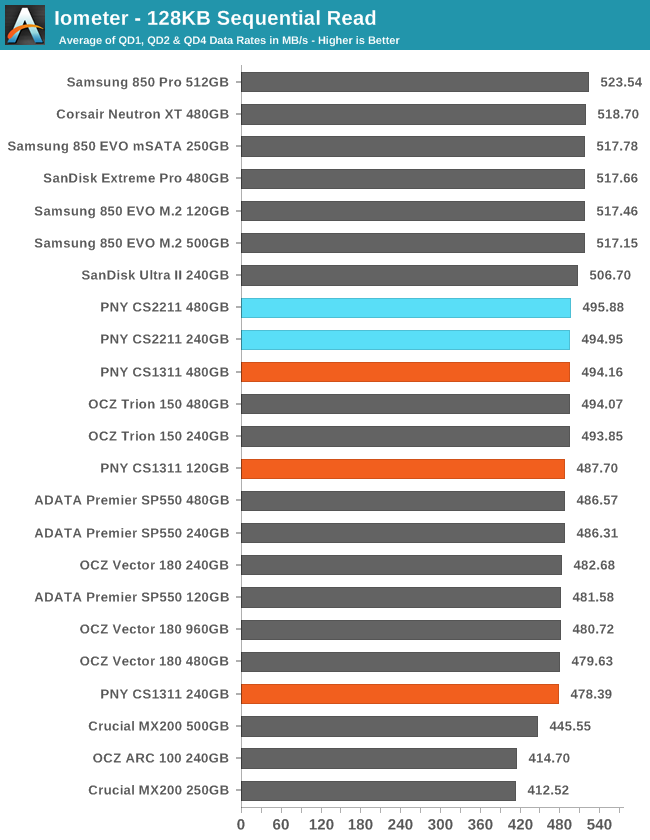
The sequential read performance of the PNY drives puts them all in the second tier of drives with lots of close competition and nothing to complain about. Choice of flash makes little difference to this benchmark: basically everything can saturate the SATA connection by QD4, so the differences here mostly reflect QD1 performance.
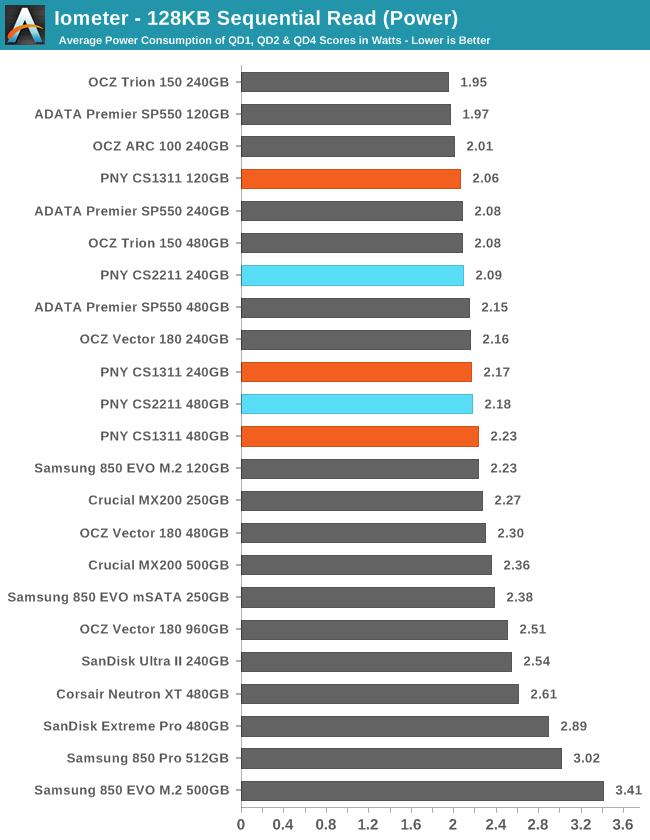
The power consumption shows that the MLC drives are a bit less power-hungry than the TLC drive of the same size (and therefore also more efficient, since the MLC drives are also faster), and that the larger drives are unsurprisingly more power-hungry.
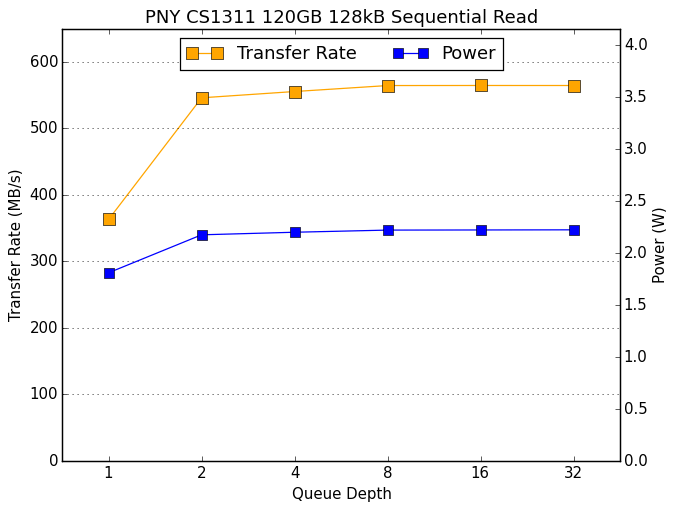 |
|||||||||
The CS2211 and the largest CS1311 hit full speed at QD2, but the smaller two TLC drives still have a little to gain from QD2 to QD8. Power consumption on all the PNY drives is flat starting at QD2.
Sequential Write Performance
The sequential write test writes 128kB blocks and tests queue depths ranging from 1 to 32. The queue depth is doubled every three minutes, for a total test duration of 18 minutes. The test spans the entire drive, and the drive is filled before the test begins. The primary score we report is an average of performances at queue depths 1, 2 and 4, as client usage typically consists mostly of low queue depth operations.
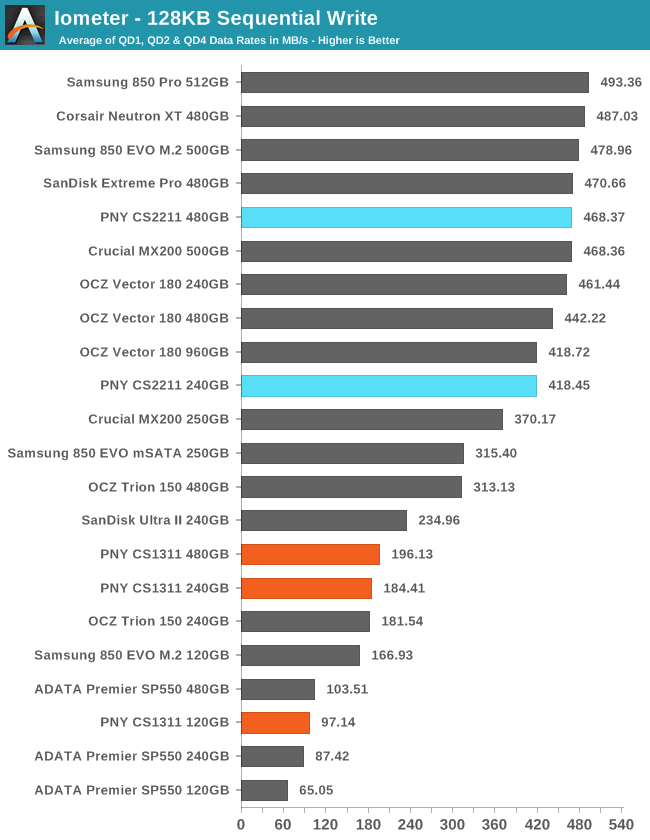
The sequential write test clearly shows the write performance advantage of TLC over MLC, and the advantage of increased parallelism in larger drives. It's interesting that the 480GB CS1311 has such a small advantage over the 240GB despite having the advantage of an 8-channel controller, while the 120GB CS1311 is clearly starved for parallelism.
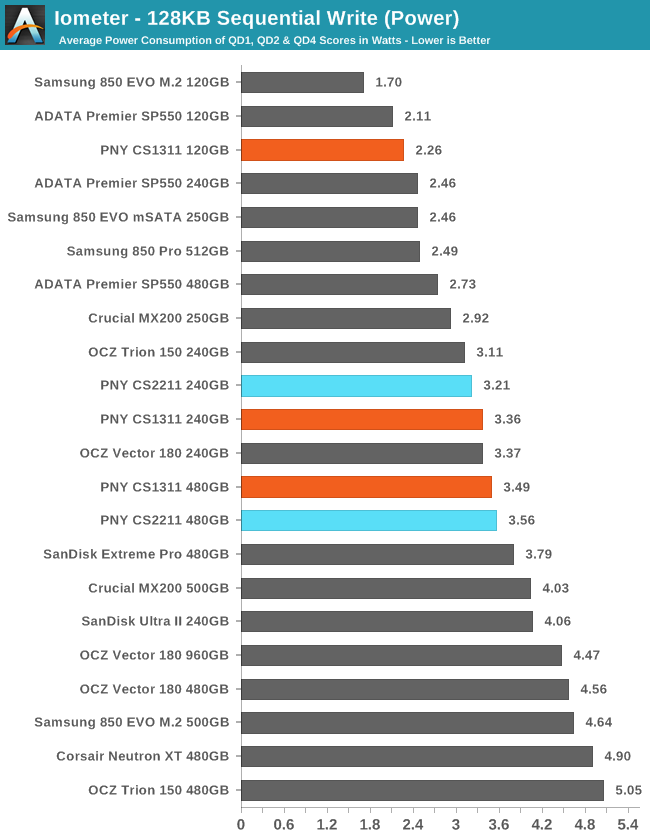
Power consumption during the sequential write test is strongly correlated with drive capacity, showing once again that the higher efficiency of MLC is offset by the higher throughput.
 |
|||||||||
The CS1311 actually drops slightly in performance from QD1 to QD2, but is stable after that. The CS2211 gains significantly from QD1 to QD2 and but scales no further.
Mixed Random Read/Write Performance
The mixed random I/O benchmark starts with a pure read test and gradually increases the proportion of writes, finishing with pure writes. The queue depth is 3 for the entire test and each subtest lasts for 3 minutes, for a total test duration of 18 minutes. As with the pure random write test, this test is restricted to a 16GB span of the drive, which is empty save for the 16GB test file.
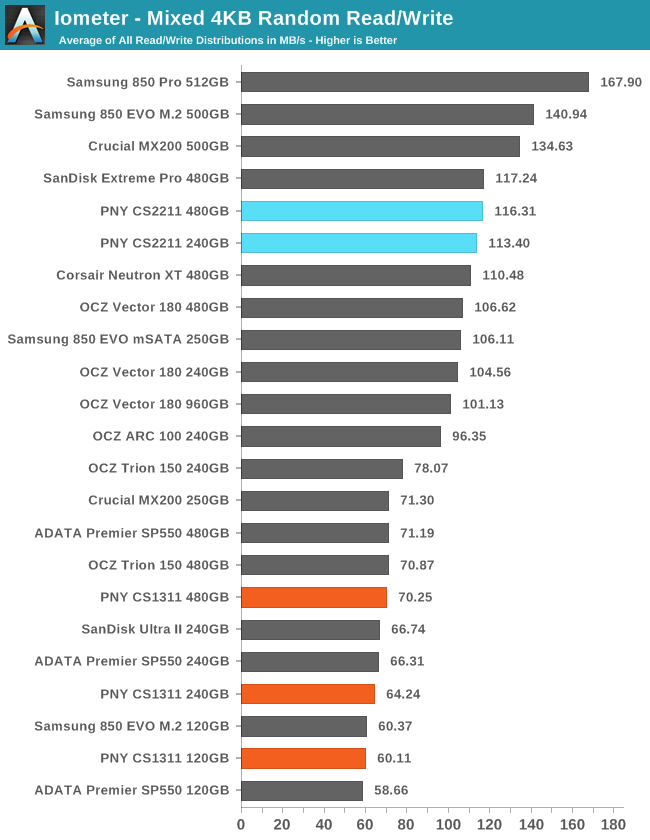
The mixed random I/O performance of the CS2211 is a little above average for MLC drives, while the CS1311 is pretty much at par for a planar TLC drive.
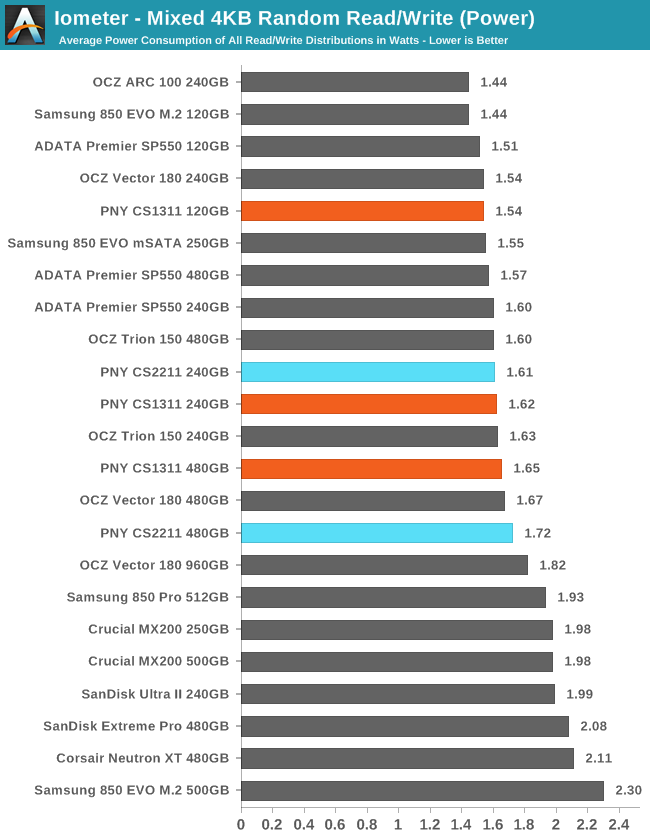
Power draw on the mixed random test follows the same patterns we've been seeing: the slowest and smallest drive draws the least power, while the largest fastest drive draws the most. All of the PNY drives are in the average range for power consumption, and the MLC drives are significantly more efficient.
 |
|||||||||
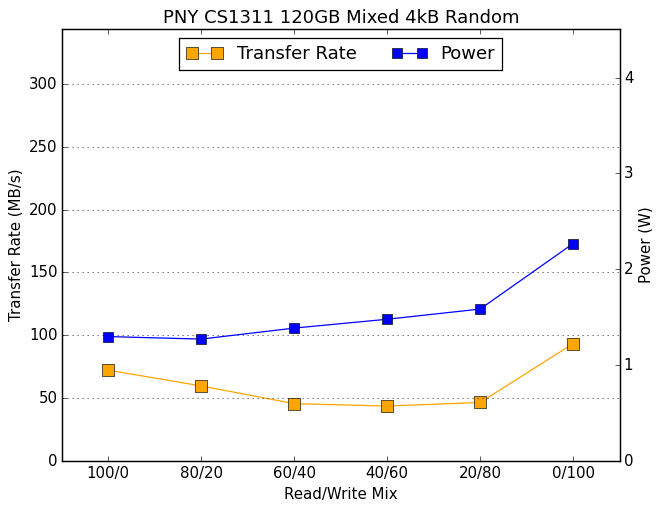
It's typical for power consumption to increase over the course of this test while performance bottoms out somewhere in the middle. The biggest difference in character between the TLC and MLC drives from PNY is that the MLC drives get a huge boost in the all-writes last phase of the test, bringing their average score way up.
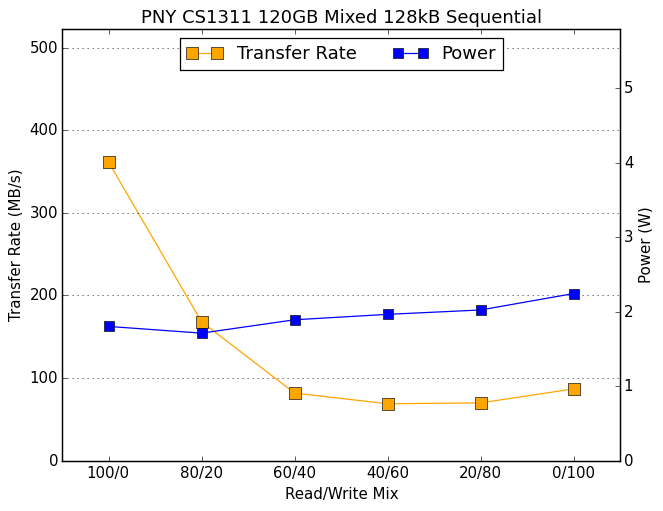
Mixed Sequential Read/Write Performance
The mixed sequential access test covers the entire span of the drive and uses a queue depth of one. It starts with a pure read test and gradually increases the proportion of writes, finishing with pure writes. Each subtest lasts for 3 minutes, for a total test duration of 18 minutes. The drive is filled before the test starts.
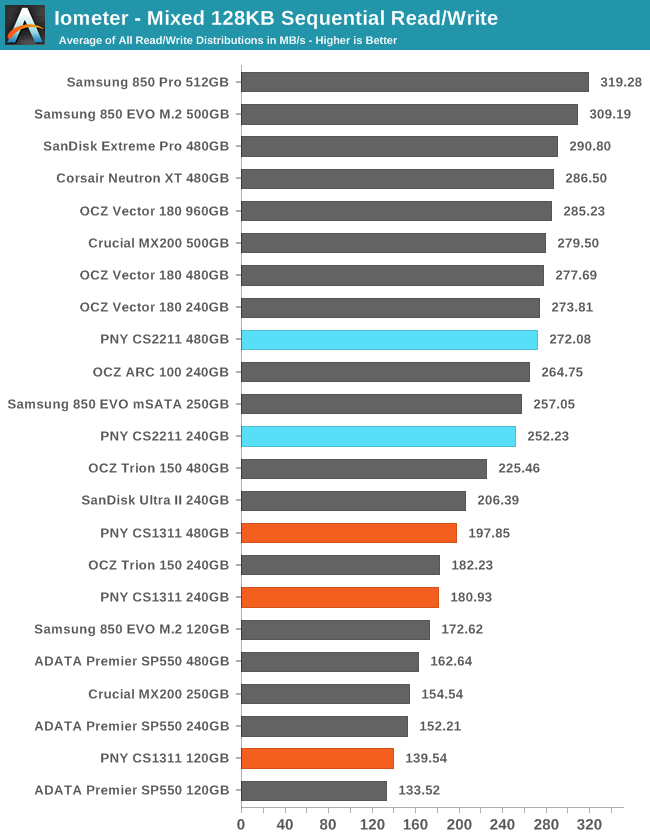
On the mixed sequential I/O test, PNY's drives range from slightly above average to second worst. The 240GB CS2211 in particular is underperforming a bit compared to its competition while the 480GB OCZ Trion 150 performs surprisingly well compared to the other TLC drives (including the 480GB CS1311).
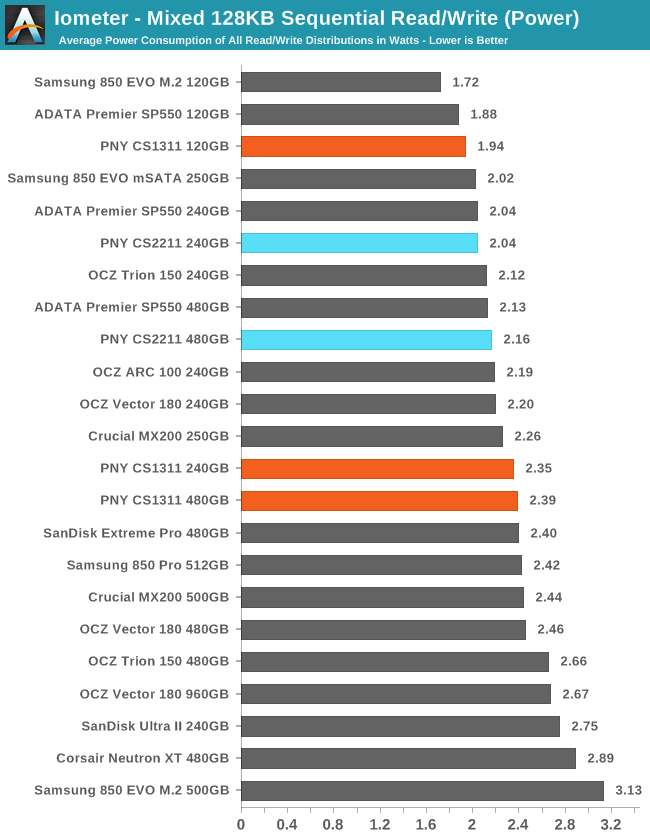
Both of the CS2211s average lower power consumption than the CS1311s of the same capacity, while the slower 120GB CS1311 again comes in as the least power-hungry of the batch (though its efficiency is nothing praiseworthy).
 |
|||||||||
The key factor in the 120GB CS1311's low power consumption is its low performance on the pure-write phase of the test, which is an unsurprising result. The other CS1311s are large enough to deliver significantly higher performance on that part of the test, but they pay the cost in increased power draw.
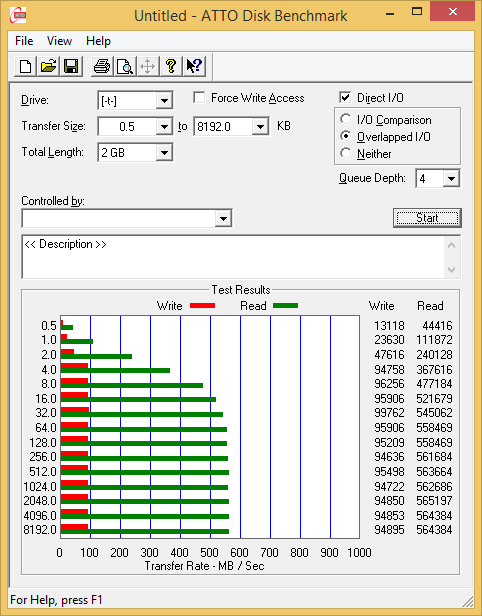
ATTO
ATTO's Disk Benchmark is a quick and easy freeware tool to measure drive performance across various transfer sizes.
 |
|||||||||
Aside from the 120GB drive's hobbled write speed, everything looks normal with the ATTO plots. The 120GB drive is just too small to deliver the full performance its controller is capable of, even though it's the smaller variant of the S10.
AS-SSD
AS-SSD is another quick and free benchmark tool. It uses incompressible data for all of its tests, making it an easy way to keep an eye on which drives are relying on transparent data compression. The short duration of the test makes it a decent indicator of peak drive performance.
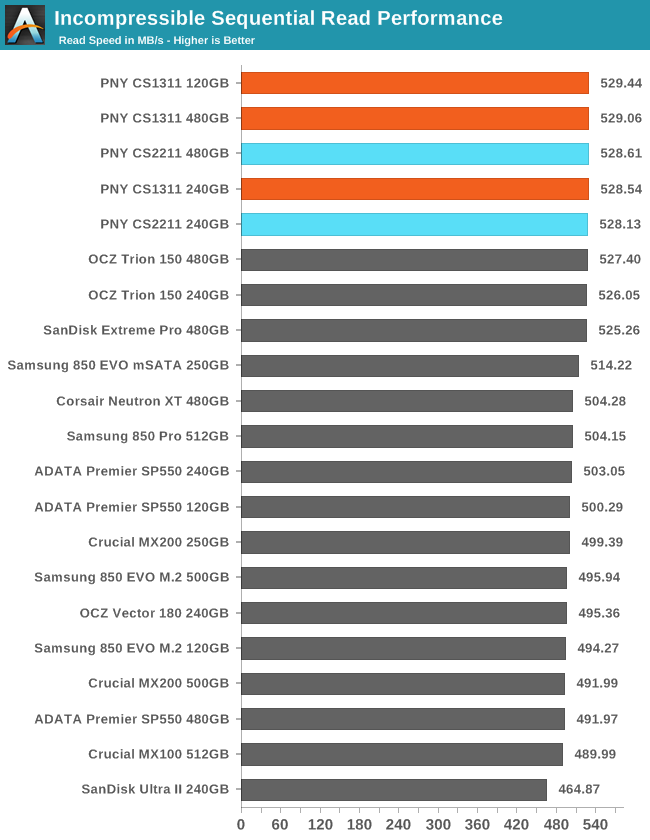
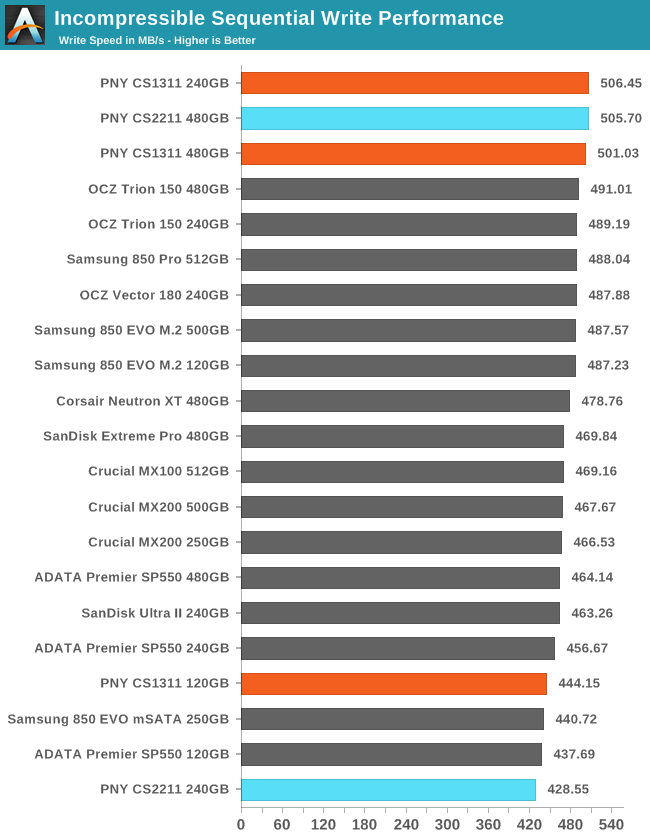
Peak sequential read speeds of the PNY drives are all top-notch, but the 240GB CS2211 is oddly slow on the write test.
Idle Power Consumption
Since the ATSB tests based on real-world usage cut idle times short to 25ms, their power consumption scores paint an inaccurate picture of the relative suitability of drives for mobile use. During real-world client use, a solid state drive will spend far more time idle than actively processing commands. Our testbed doesn't support the deepest DevSlp power saving mode that SATA drives can implement, but we can measure the power usage in the intermediate slumber state where both the host and device ends of the SATA link enter a low-power state and the drive is free to engage its internal power savings measures.
We also report the drive's idle power consumption while the SATA link is active and not in any power saving state. Drives are required to be able to wake from the slumber state in under 10 milliseconds, but that still leaves plenty of room for them to add latency to a burst of I/O. Because of this, many desktops default to either not using SATA Aggressive Link Power Management (ALPM) at all or to only enable it partially without making use of the device-initiated power management (DIPM) capability. Additionally, SATA Hot-Swap is incompatible with the use of DIPM, so our SSD testbed usually has DIPM turned off during performance testing.
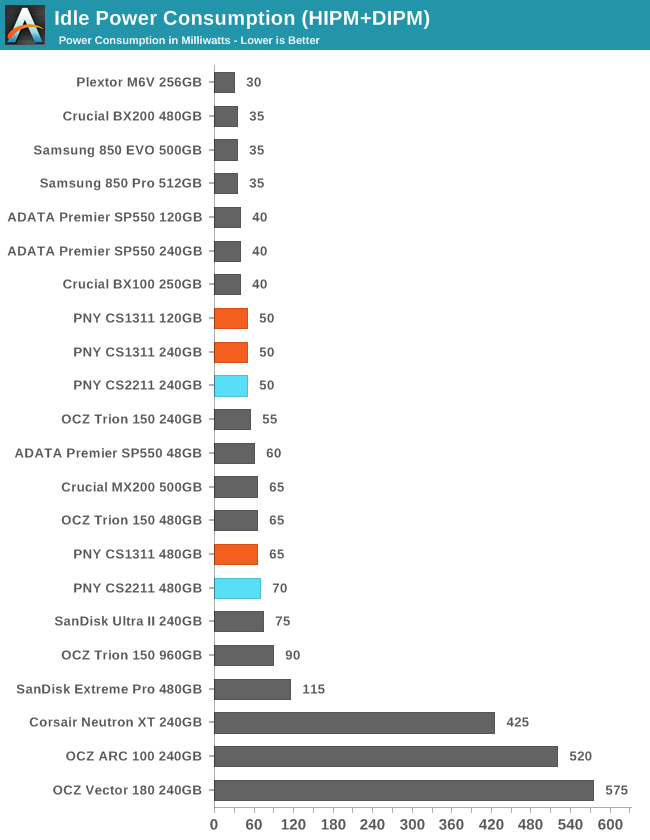
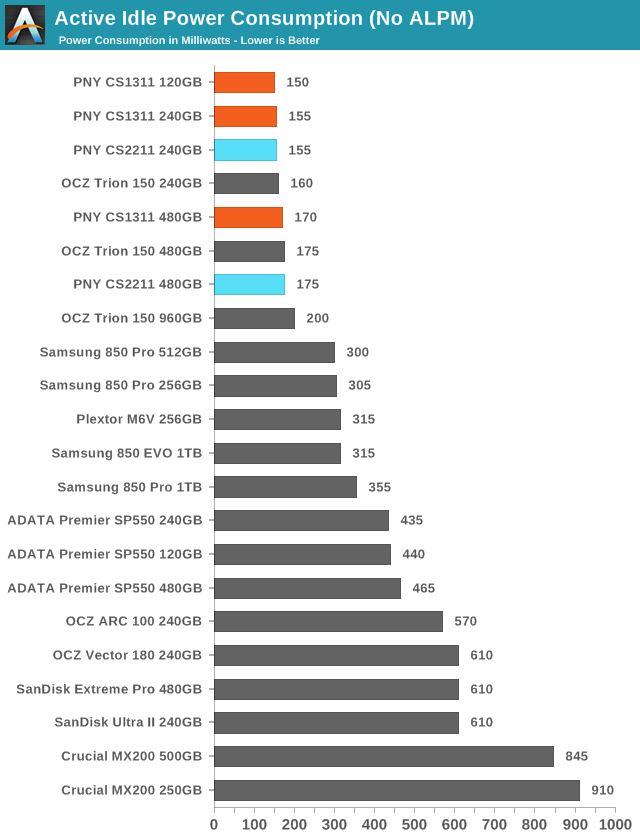
The S10C controller does seem to save a bit of power over the larger S10-X, with and without ALPM. The S10C sets a new record for the best idle power without ALPM.
Final Words
The Phison S10 controller and SSD platform debuted in late 2014, and it is more popular than ever. PNY's CS1311 and CS2211 drives show us how the platform has evolved and what we can roughly expect from this year's S10 drives that use the latest firmware and 15nm NAND. With an entry-level model and a higher-performance mainstream SSD, PNY's latest drives cover the highest-volume segments of the SSD market.
The PNY CS1311, for the most part, squeezes in between two other 15/16nm TLC drives we've tested recently: ADATA's Premier SP550 and OCZ's Trion 150. This goes for both performance and price: the Trion 150 is the highest-performing and most expensive of the three, while the SP550 is slightly cheaper than the CS1311 but they trade places in many benchmarks. The CS1311 has generally better write speeds, which are the SP550's most acute weakness, but the SP550's steady-state write speed is significantly better.
The comparison of the CS1311 against the OCZ Trion 150 is particularly interesting. They both use nominally the same flash (Toshiba 15nm TLC) and the Toshiba TC58 controller on the Trion 150 is clearly a close relative of the Phison S10-X, but the Trion 150 is consistently more power efficient and matches or exceeds the performance of the CS1311 on almost every test. It's clear that there's something custom about the Trion 150 that sets it apart from the rest of the Phison S10 crowd, but it's not clear whether it is differences in the controller silicon or firmware or NAND selection.
Being positioned in the middle of the market, the MLC-based CS2211 has a lot more potential competitors and pricing isn't quite the overriding factor that it is for the entry-level TLC drives. Our test data doesn't have full coverage of the 2.5" versions of the Samsung 850 EVO or the latest firmware revision of the Crucial MX200, but we can still make some important conclusions about how they stack up. At 480GB, the CS2211 is a toss-up against the 500GB MX200. Their prices currently match and they perform very similarly overall. With fixes to its SLC caching the 250GB MX200 is probably a slightly better overall performer than the 240GB CS2211, and at the moment the MX200 is also a few dollars cheaper. The Samsung 850 EVO uses the same controller architecture as the 850 Pro and on most tests is one of the two or three fastest SATA drives in its capacity class. For only a few dollars more, it's a reasonable to pick the 250GB 850 EVO over the 240GB CS2211. The pricing gap is quit a bit bigger at 480GB/500GB, and it might not be worth the premium.
| SSD Price Comparison | |||
| Drive | 480GB/500GB | 240GB/250GB | 120GB |
| ADATA SP550 | $107.99 | $57.99 | $37.99 |
| PNY CS1311 | $109.99 | $59.99 | $39.99 |
| OCZ Trion 150 | $129.99 | $61.99 | $45.99 |
| SanDisk Ultra II | $129.99 | $74.99 | $54.79 |
| Crucial MX200 | $139.00 | $81.72 | |
| PNY CS2211 | $134.96 | $84.96 | |
| Samsung 850 EVO | $149.99 | $88.00 | |
The MLC vs TLC comparison between the PNY drives reveals some interesting patterns. First, the garbage collection routines are very different, as shown by the performance consistency tests. The TLC drive has what seems to be the newer and much more consistent behavior while the MLC drive is widely variable. But for all of that, the MLC drive steady-state average is better. And while it's true that TLC flash generally consumes more power (especially for write operations), the TLC drives did not draw significantly more power than the MLC drives of the same capacity. The MLC drives just get a lot more work done with the same amount of energy.
The new cut-down S10C controller used in the 120GB and 240GB models do not seem to have brought any new performance limitations relative to the full-size S10-X used in the 480GB models and all previous Phison S10 drives we've tested. It's a cost-cutting measure that is quite welcome, especially since it will reduce the incentive for entry-level models to adopt Phison's single-core DRAM-less S11 controller.


